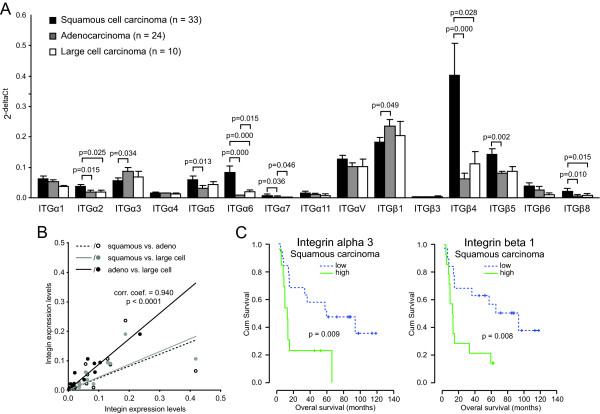
Figure 4.
Integrin expression profile and survival in subtypes of NSCLC. A) Bar graph showing the subtype specific integrin expression. B) Scatter plot showing the correlation in integrin expression between the different subtypes of NSCLC. C) Kaplan Meier plots of overall survival of patients with low (below median) or high (above median) expression of the indicated integrins in squamous carcinoma.

