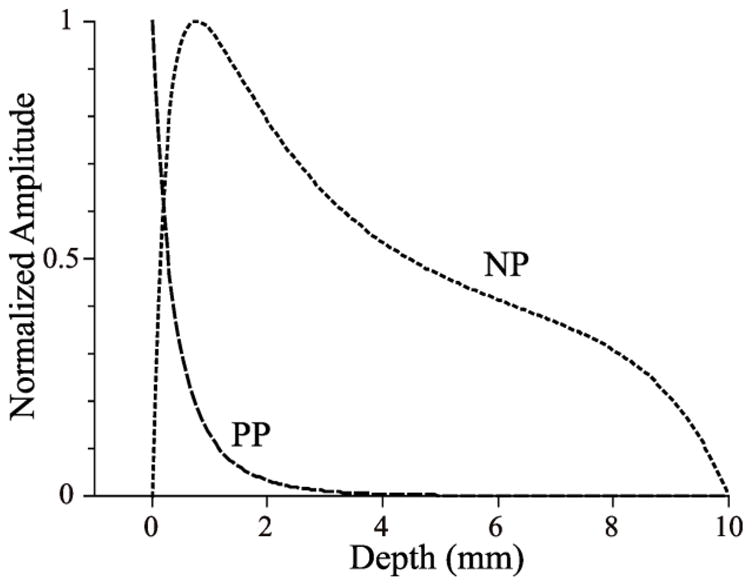
Figure 2. Representation of myocardial layers in reflection and transillumination images.

The depth dependences of peak epicardial pixel intensities are shown in PP and NP imaging modes. The curves were calculated using the diffusion approximation. The dimensionless excitation and emission attenuation lengths, relative to the slab thickness, are 0.25 and 0.33 in both modes. Here, we see that NP is probing deeper than PP; the latter more strongly emphasizes the epicardial layer itself.
