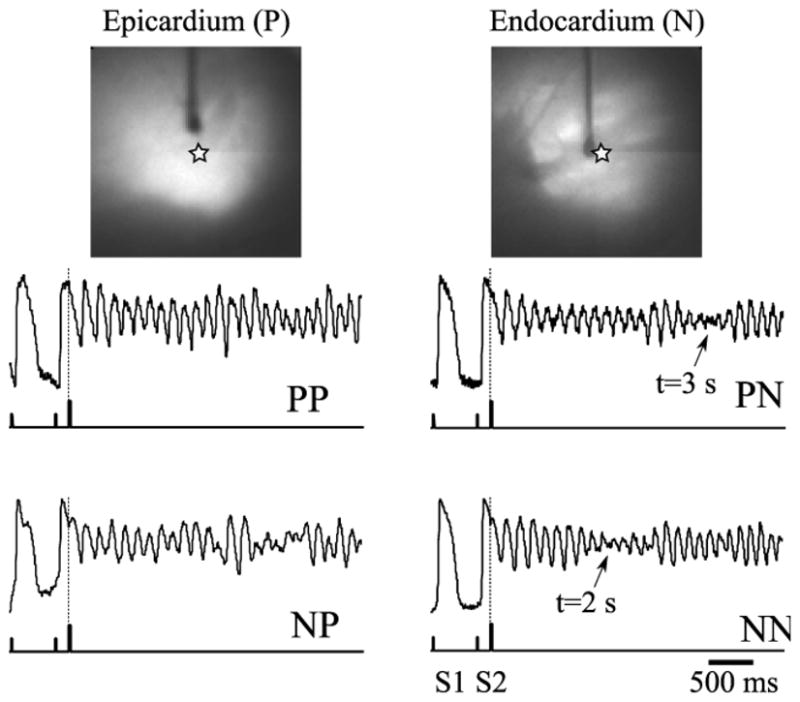
Figure 3. Initiation of a polymorphic tachycardia via premature stimulation.

Top: Epicardial and endocardial views of the preparation. Vertical dark shadows show the stimulating electrodes. Bottom: Single pixel recordings near the tip of the stimulating electrode (indicated as a star on top panels) extracted from the PP, PN, NP, and NN movies. The (x,y) coordinates of the pixel are the same for all four traces. The ticks on the lower trace show the timing of the basic (S1) and the premature (S2) stimuli. Note a significant decrease in signal amplitude in PN and NN recordings at 2 and 3 seconds past the arrhythmia initiation (arrows). The drop is caused by a drifting filament passing the recording site.
