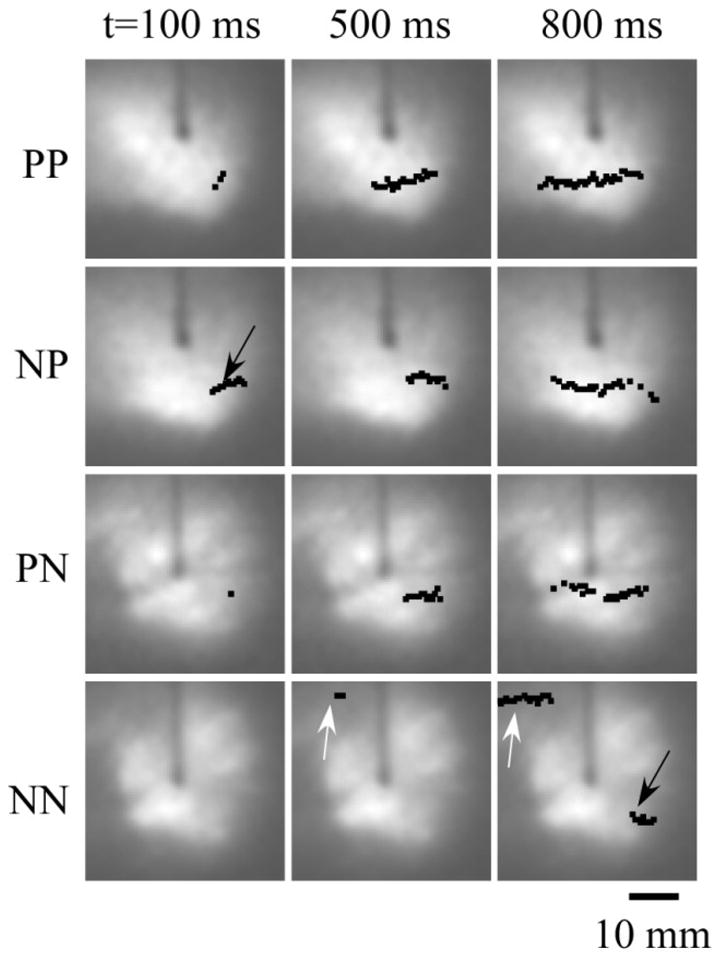
Figure 4. Filament dynamics in various layers.

Black dots and arrows show the location of the filament center. Numbers on top indicate the time after the S2 stimulus. The filament originates in the NP layer, grows slowly, and reaches the endocardial NN layer at t=800 ms. White arrows show the formation and growth of the second filament in the NN layer.
