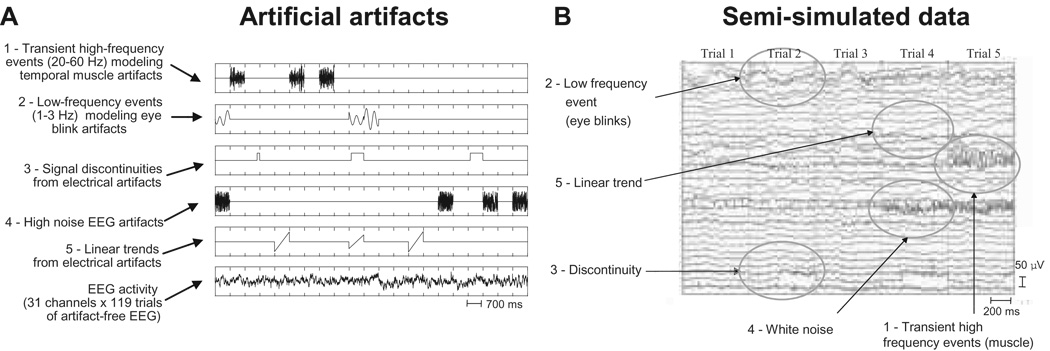
Figure 1.
A. Types of simulated artifacts (top panels) introduced into actual EEG data epochs (bottom panel ordinate, ± 50 µV). Ticks indicate 700-ms epoch boundaries. B. Simulated data obtained by adding the simulated artifacts (A) to the EEG data. Artifacts shown here were the largest simulated (0 dB); the smallest were more than 30 times smaller (−50 dB).

