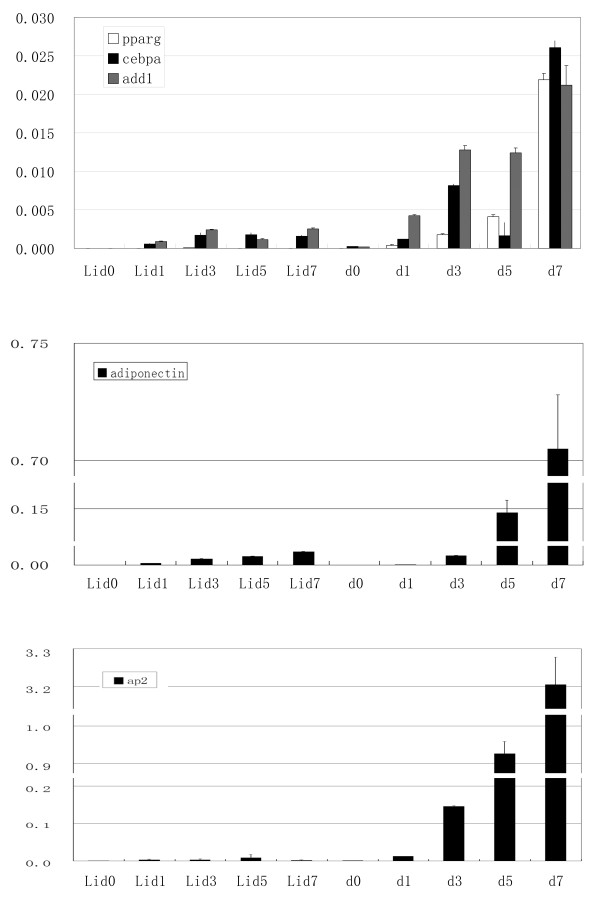
Figure 2.
The molecular evidence of cell models construction. (A) Expression of Pparg, Cebpa, and Add1; (B) Adiponectin and (C) aP2 during induction in the two cell models. X-axis indicated the time course of differentiation. d0, d1, d3, d5, d7 mean the days of MDI induced differentiation; Lid0, Lid1, Lid3, Lid5, Lid7 mean the days of MDI induced differentiation of cells treated with Lithium. Y-axis indicates the expression of the detected genes relative to the internal reference gene Gapdh.

