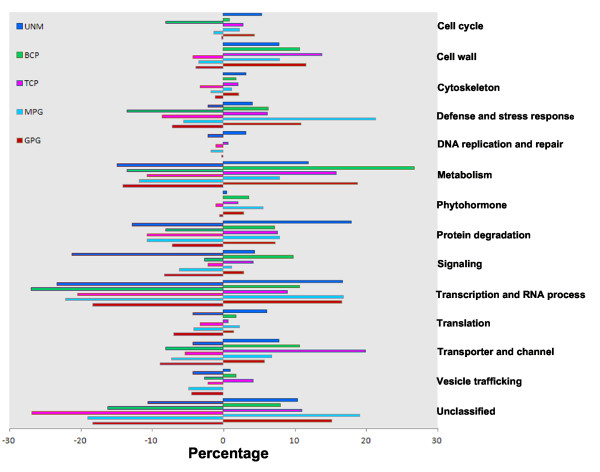
Figure 3.
Distribution of functionally annotated development stage-enriched and -downregulated genes in the different functional groups. The genes were classified into 13 functional groups and one unclassified group. Positive and negative numbers denote the percentage of stage-enriched and -downregulated functional groups, respectively. Corresponding detailed information is listed in Additional file 5a and b (stage-enriched) and c and d (stage-downregulated).

