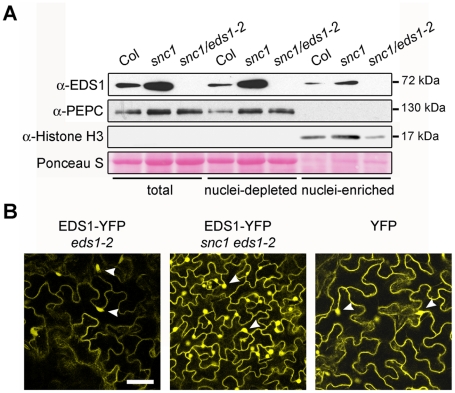
Figure 1. Deregulated resistance in snc1 leads to increased accumulation of EDS1 in the nucleus and cytoplasm of Arabidopsis leaves.
(A) Western blot showing EDS1 protein levels in total, nuclei-depleted and nuclei-enriched fractions prepared from 4-week-old soil grown plants. PEPC was used as cytosolic marker and Histone H3 as nuclear marker. Molecular weight of protein markers are shown on the right. Nuclei-enriched fractions are 30× concentrated (v/v) compared to nuclei-depleted fractions. (B) Confocal images of leaves from snc1 and snc1/eds1-2 transgenic plants expressing EDS1-YFP fusion under the control of the EDS1 native promoter. A confocal image from a stable transgenic line expressing free YFP protein from 35S promoter is provided for comparison. Images were taken at identical microscope settings. Scale bar is 40 µm and white arrowheads depict nuclei.

