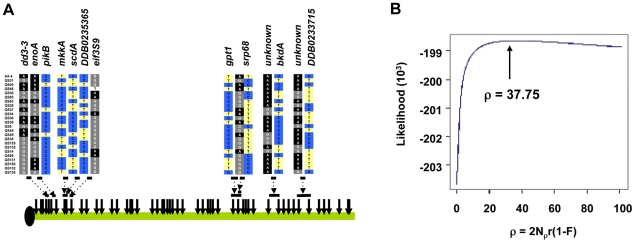
Figure 9. Recombination in the D. discoideum genome.
(A) The locations of several recombination events between SNPs are indicated by the horizontal bars and the sequence at those SNPs are shown. The SNPs and the genes they are found in are shown and color-coded. Each row of SNPs represents an individual D. discoideum strain. The dotted arrows indicate the SNPs flanking the recombination events, which are inferred by the presence of all 4 possible genotypes between SNP pairs. (B) Composite likelihood plot of estimates of ρ. The plot shows a steep decrease in likelihood at approximately ρ<10, and the maximum is at ρ = 37.75. The likelihood surface is nearly flat at approximately ρ>20.

