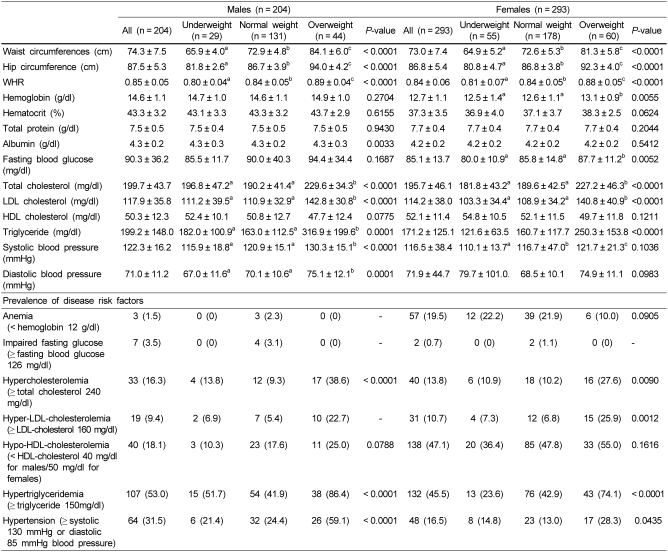
Table 2.
Anthropometric parameters, blood profiles and prevalence of disease risk factors by BMI distribution of adult Vietnamese subjects in rural areas1)
1)Values are mean ± SE or number (%). Calculated using Duncan's multiple comparison tests or a Mantel-Haenszel χ2 test adjusted for age.
Different letters within a row represent statistically significant differences between three BMI groups.

