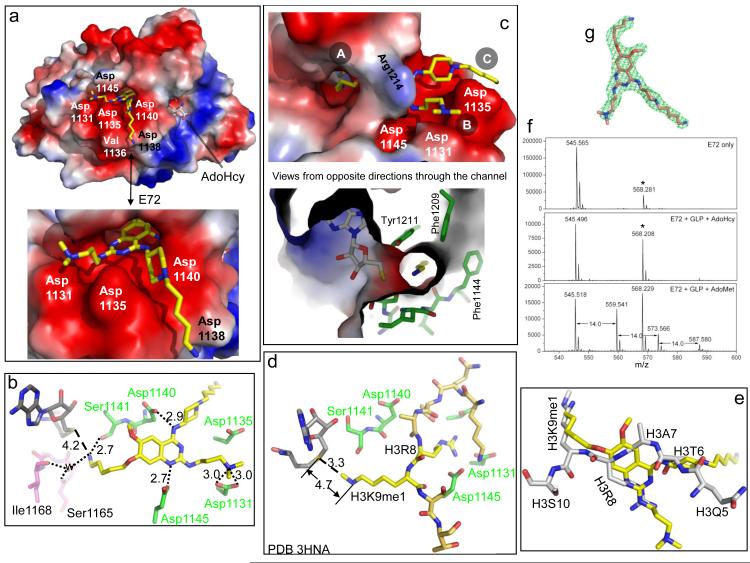
Figure 2. Structure of GLP-E72-AdoHcy complex.
(a) Surface representation of the GLP catalytic domain with AdoHcy and E72 bind in two distinctive pockets. The surface charge at neutral pH is displayed as red for negative, blue for positive and white for neutral. (b) Network of hydrogen bonds centered on E72. (c) The 5-aminopentyloxy moiety occupies the target lysine-binding channel, views from opposite directions. (d) The structure of GLP-AdoHcy-histone H3 peptide containing H3K9me1 (PDB 3HNA) 8. (e) Superimposition of histone H3 peptide (taken from PDB 3HNA) and E72 (yellow). (f) E72 is methylated by GLP under the reaction conditions of 1.5 μM GLP, 1.6 μM E72, 100 μM AdoMet in the buffer of 20 mM Tris pH 8.5, 5 mM DTT and 2% DMSO. The mixture was incubated for 3 h at 30 °C and then overnight (~16 h) at room temperature (~21 °C). The mass peak at 568 Da (indicated by an asterisk) is from the matrix used in the mass spectra measurement (Supplementary Fig. S3b). (g) Omit electron density, Fo-Fc (green mesh), contoured at 4σ above the mean, is shown for E72.

