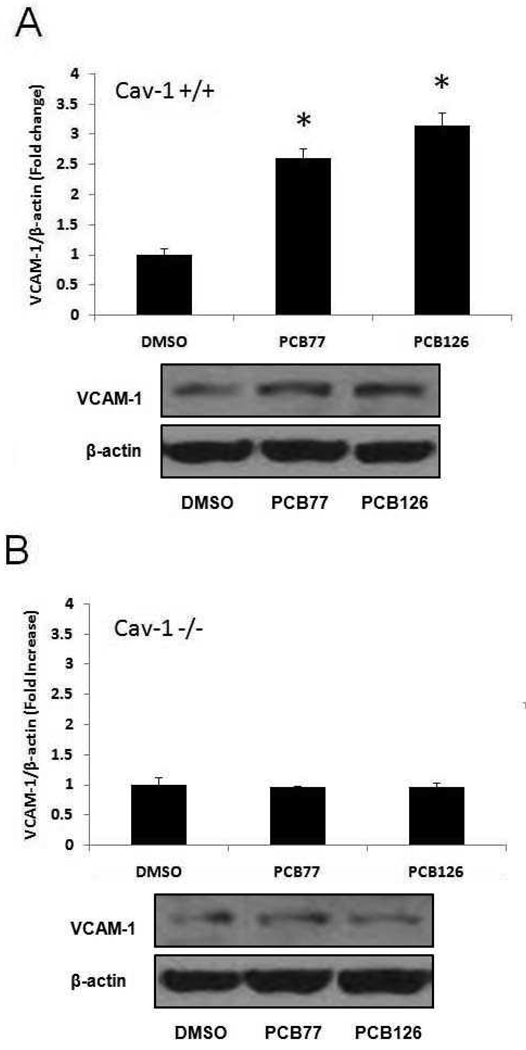
Figure 5.
Expression of VCAM-1 in MAECs exposed to coplanar PCBs. Cells were exposed to DMSO or 2.5 µM PCB77 or PCB126 for 16 h, and protein levels were measured using Western blot analysis. Protein expression levels were detected in PCB treated MAECs containing caveolin-1 (A) and in caveolin-1-deficient cells (B). Densitometry results were normalized to β-actin, and represent the mean ± SEM (n=3) of three independent experiments. The Western blot picture shown is a representative of three independent blots. *Significantly different compared to DMSO control.

