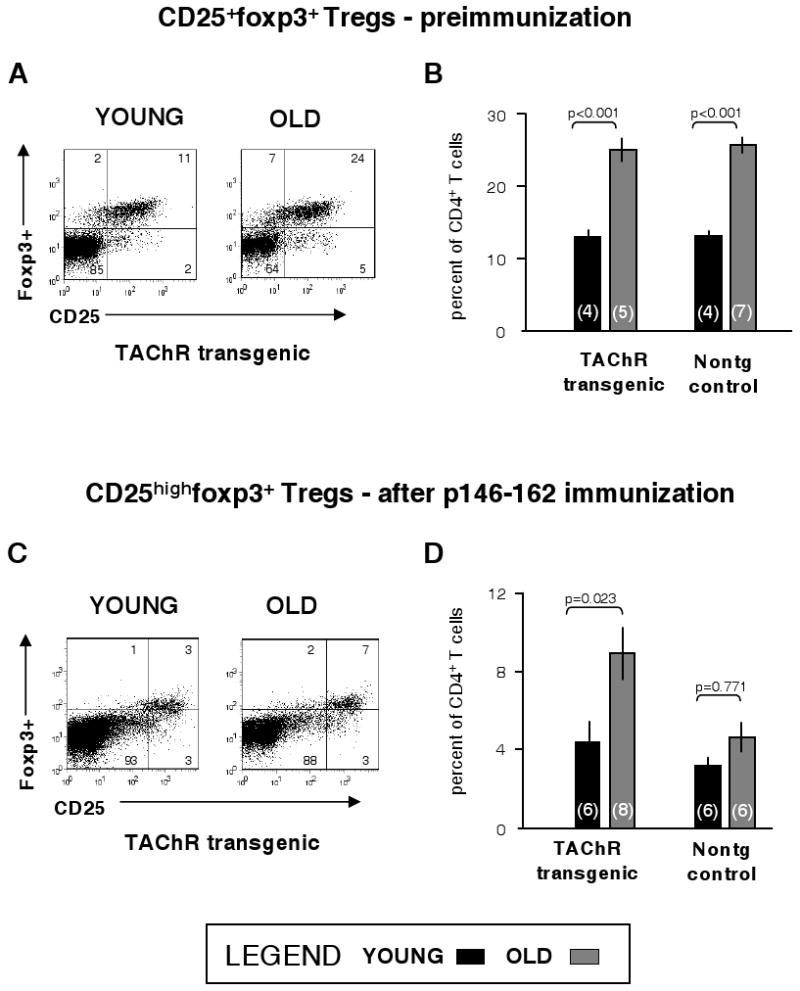
Figure 7.

Effects of age on Treg frequency. Inguinal, axillary, brachial, and periaortic lymph node cells were extracted from unimmunized young (3 months of age) and old (21-22 months of age) mice. Cells from each animal were stained for CD4, CD25, and foxp3 or an anti-foxp3 antibody isotype control (IgG2a) using fluorochrome-conjugated antibodies as described in Methods and were analyzed by FACS. The experiment was then repeated with mice of the same ages and the results combined for analysis. Tregs were defined as foxp3+CD25+CD4+; they were quantified from the FACS plots for transgenic and nontransgenic animals. Representative dot plots for one transgenic mouse of each age are shown (Panel A) and the data for all analyzed animals are summarized (Panel B). The number of mice per group is given parenthetically. Another group of young (2-4 months old) and old (20-23 months of age) mice was immunized with p146-162; draining lymph node cells were extracted, expanded in vitro with p146-162 and stained for FACS analysis. The experiment was then repeated with additional mice of the same ages. Sample plots are shown (Panel C) and the percent of CD25highTregs in the CD4+ T-cell population is summarized graphically for all animals (Panel D). Error bars represent ±S.E.M.
