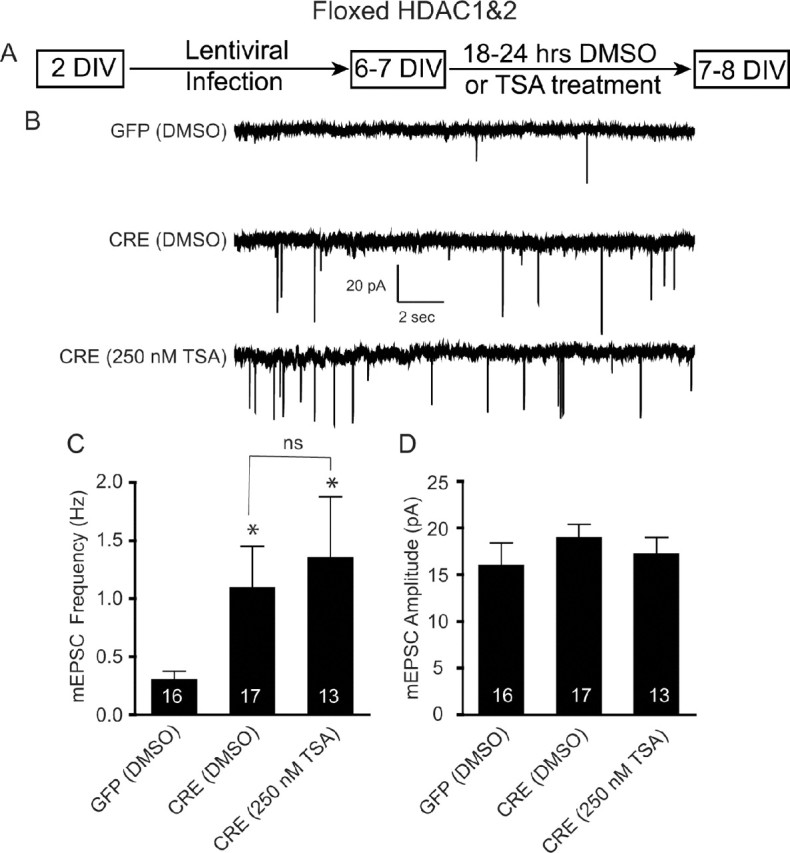
Figure 3.

Occlusion of TSA-mediated increase in mEPSC in immature neurons lacking HDAC1&2. A, Schematic timeline of the experiment. Floxed HDAC1&2 neurons were plated, infected with lentivirus expressing either GFP or CRE at 2 DIV, treated with DMSO or TSA (250 nm) at 6–7 DIV, and recorded 18–24 h later. B, Representative recordings of miniature excitatory events in GFP- and CRE-infected neurons treated with either DMSO or TSA. Recordings were made in Tyrode's solution containing 1 μm tetrodotoxin and 50 μm picrotoxin. C, Bar graph showing that the loss of HDAC1&2 results in a significant increase in mEPSC frequency and that TSA treatment did not result in a further increase in mEPSC frequency. D, Bar graph of mEPSC amplitudes revealing no change following TSA treatment on HDAC1&2 knockdown neurons.
