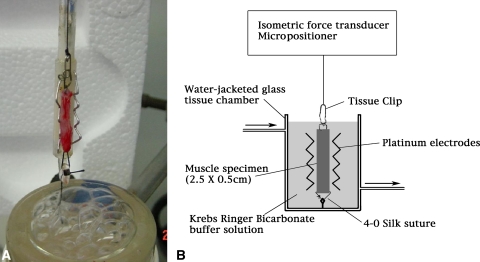
Fig. 3A–B.
(A) A photograph and (B) schematic diagram illustrate the apparatus for assessing muscle contractile force after twitch and tetanic stimulation. The muscle sample was mounted as shown and lowered into the tissue chamber. Optimal fiber length of the specimen was determined using a micropositioner to identify the length producing maximal contractile force. Measurements were taken using an isometric force transducer.

