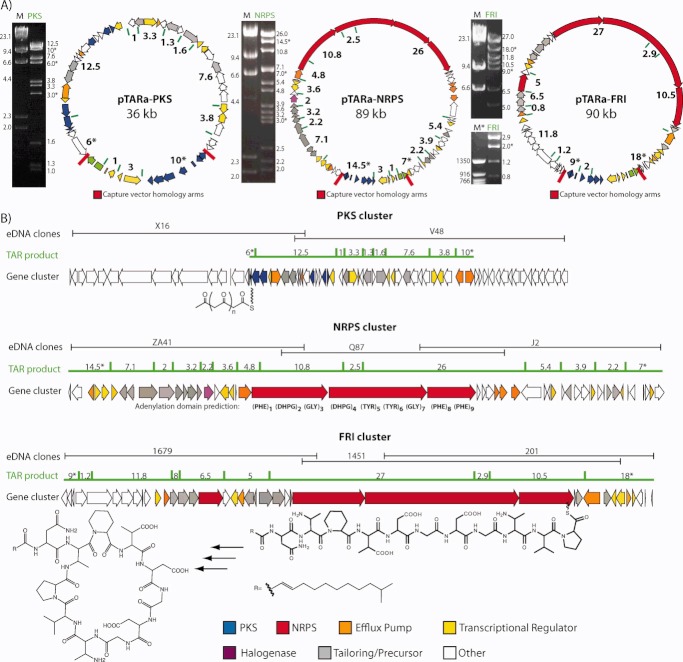
FIGURE 6.
A) Experimentally determined restriction maps and predicted restriction enzyme cut sites for each reconstructed gene cluster are shown. The size of each gene cluster is listed for clarity. (M = Lambda HindIII digest, M* = 50 bp ladder). B) The overlapping cosmids (black) comprising a complete biosynthetic pathway is shown above the region targeted for TAR assembly (green line). The individual building blocks that are predicted to be used by the conserved modules (PKS and NRPS) found in these biosynthetic pathways appear below each gene cluster (DHPG = dihydroxyphenylglycine).42

