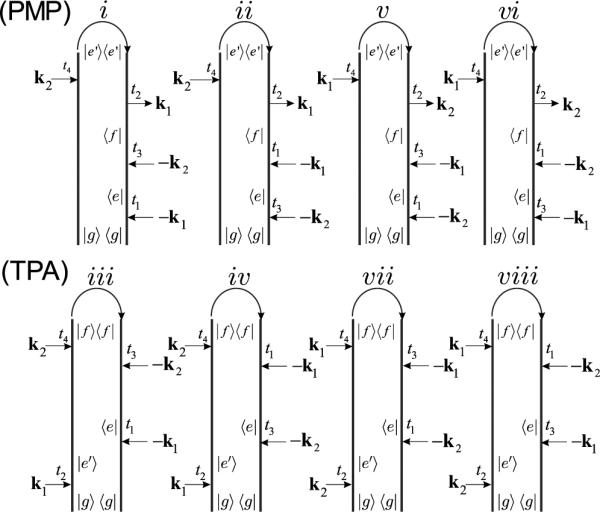
FIG. 2.

CTPL diagrams for the contributions to the pump-probe signal which contain ω1+ω2=ωfg resonances. By convention, the last interaction is an absorption and occurs at the left branch of the loop. Diagrams i–iv represent k1 (pump) and k2 (probe)[v–vii are k1 (probe) and k2 (pump)]. The top row diagrams represent pump modulated probe (PMP) where the system ends in the singly excited state |e〉〈e|. The bottom row diagrams represent two-photon absorption (TPA) where the matter ends in the doubly excited state |f〉〈f|.
