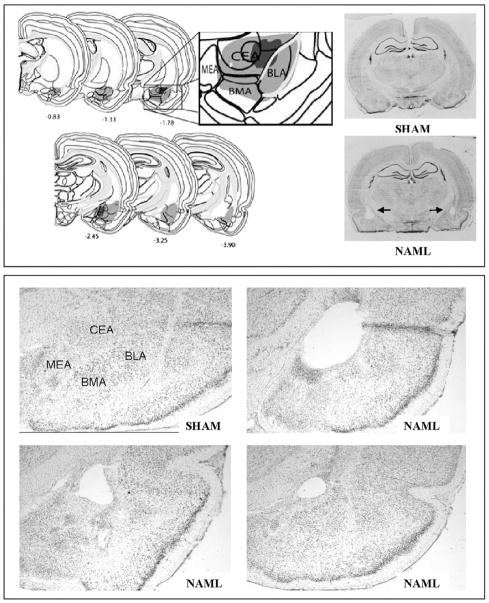
Figure 2.
Histological verification mapping (upper panel, left) showed minimal (dark gray) and maximal (light gray) extents of lesions in brains of subjects included in the study: 25 rats with neonatal amygdala lesions (NAML) vs. 24 SHAM-operated controls. Coordinates shown are relative to bregma based on work by Swanson, 2004. Damage was usually centered at the boundary of the central (CEA) and basolateral (BLA) nuclei but often extended into the basomedial (BMA) and medial (MEA) nuclei. Exemplary whole coronal sections from a SHAM brain and a NAML brain with bilateral CEA/BLA damage (upper panel, right) is denoted by arrows. Exemplary sections from a SHAM and 3 different NAML brains featured at 25× magnification (lower panel) show variation in lesion damage with differential extents of cellular change and frank vacuolization in the amygdala. All sections were taken from approximately the same level relative to bregma (e.g. −2.5).

