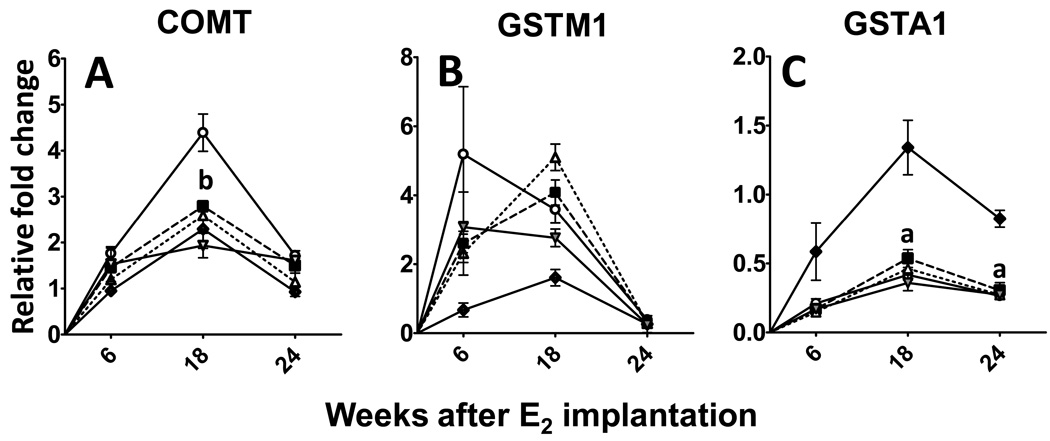
Figure 4. (A–C). Effect of berry and ellagic acid diets on E2-induced changes in phase II enzyme expression.
ACI rats (n=6) were treated with either sham implants or E2 (27 mg) for 6, 18 or 24 weeks and fed a control diet (SH-CD, ◆; E2-CD, ○ ) or diet supplemented with 2.5% w/w black raspberry (E2-BRB, △), blueberry (E2-BB, ■ ) or 400 ppm ellagic acid (E2-EA,  ). The whole mammary mRNA was analyzed for A- Catechol-O-methyl transferase (COMT); B- Glutathione S transferase M1 (GSTM1); and C- GSTA1 expression using qRTPCR as described in Materials and Methods. The relative fold change was calculated using the 2−ddcT method with a sample from SH-CD as the calibrator for each particular time point. a- significantly different from SH-CD, p<0.05; b- significantly different from E2-CD, p<0.05.

