
Figure 1.
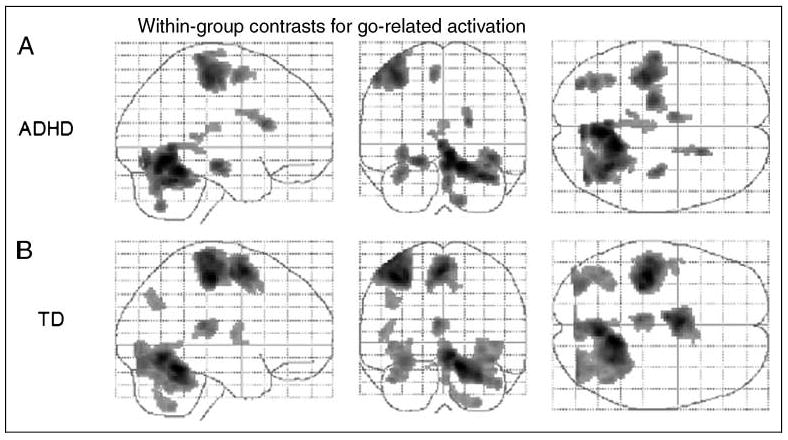
Effects for go events within the (A) ADHD group and (B) TD controls. Transparent brain maps showing regions where the time courses were significant covariates of fMRI signal changes for go trials. These results are based on a random effects analysis of 25 subjects per group using an uncorrected threshold p = .001 and a cluster size threshold of 72 (equivalent to a corrected threshold p = .05). Neurologic convention is used (i.e., right = right hemisphere; projections looking rightward or into the page). For both groups, main effects of go are visible in the left primary sensorimotor cortex (BA 3/4), left supplementary motor area (“SMA,” BA 6), right anterior superior cerebellum (culmen), left posterior superior cerebellum, and bilateral occipital lobes (BA 19). In the ADHD group, additional effects are seen in the left parahippocampal gyrus (BA 35), right hippocampus, and right caudate; in the TD group, additional effects are seen in the left angular gyrus (BA 39).