
Figure 1.
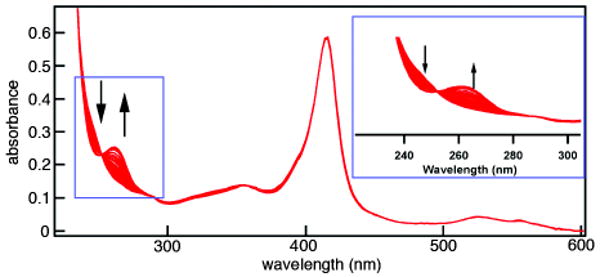
Representative changes in the absorption spectrum of HQuin1 upon M2+ binding. Shown here are the series of absorption spectra for Zn titration. (Inset) Observed changes in absorbance of Quin upon metal binding.
Official websites use .gov
A
.gov website belongs to an official
government organization in the United States.
Secure .gov websites use HTTPS
A lock (
) or https:// means you've safely
connected to the .gov website. Share sensitive
information only on official, secure websites.
Representative changes in the absorption spectrum of HQuin1 upon M2+ binding. Shown here are the series of absorption spectra for Zn titration. (Inset) Observed changes in absorbance of Quin upon metal binding.