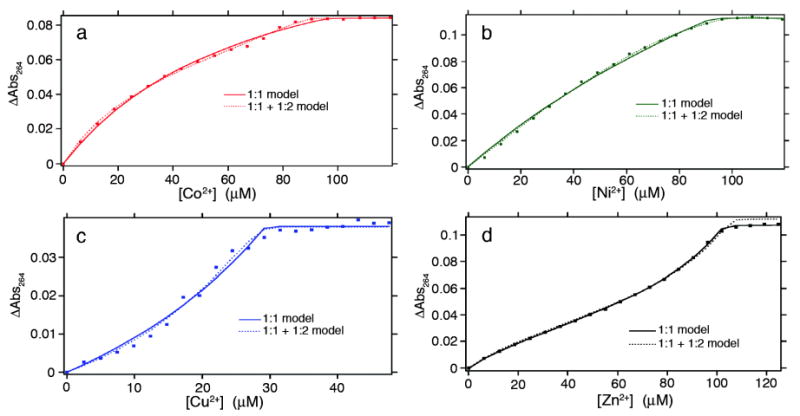
Figure 2.

Metal binding titration data and fits for HQuin1 (3 – 5 μM) in the presence of EGTA (25-100 μM) as a competing ligand and various concentrations of (a) Co2+, (b) Ni2+, (c) Cu2+, (d) Zn2+ as monitored by UV-vis spectroscopy. Regression analysis was performed using both a simple 1:1 (solid line) metal:protein binding model and a combined 1:1 and 1:2 (dotted line) model, the latter of which accounts for metal-induced protein dimerization. A minimum of two titrations under identical conditions were performed for each metal and their results averaged. Metal dissociation constants (Kdmetal) determined through these titrations are listed in Tables 1, S2.1 and S2.2. DynaFit expressions used for data fitting are given in the Supporting Information.
