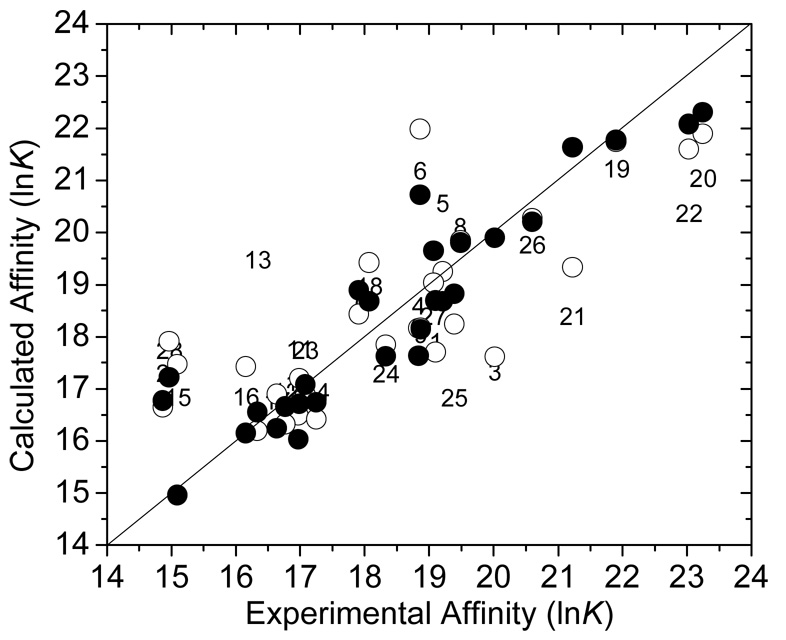
Figure 1.
Comparison of the experimental versus calculated binding affinity (lnK) for the one-mode model (Eq. 1) with minimization (the compound number, see Supplementary Information for structures) and conformational sampling (○, Eq. 1), and for the multi-mode conformational sampling (●, Eq. 4). The optimized coefficient values are given in Table 1.

