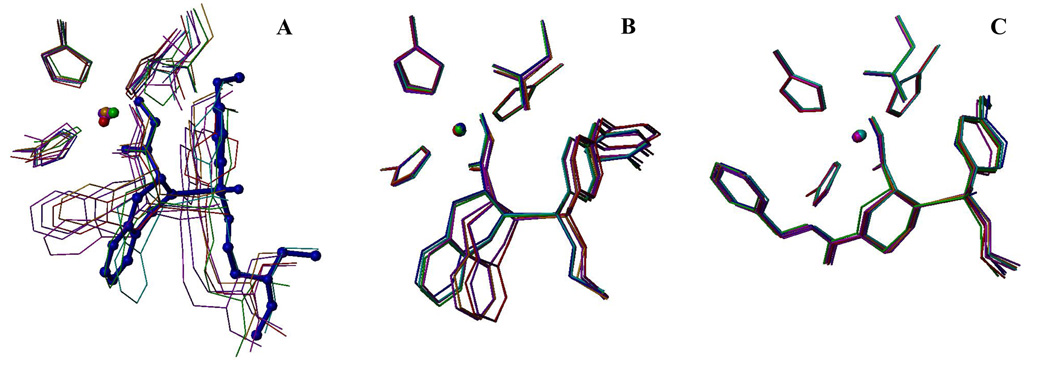
Figure 2.
Binding modes of compounds 7 (A), 22 (B), and 27 (C). The mode representing 40% or more of the bound ligand is displayed in balls and sticks (A). The time-averaged structures for 25-ps simulation intervals represent individual modes and are color-coded (modes 1 to 8, respectively): cyan - 0–25 ps, blue - 25–50 ps, green - 50–75 ps, magenta - 75–100 ps, orange - 100–125 ps, purple - 125–150 ps, red - 150–175 ps, and violet - 175–200 ps). The structures were superimposed using the α-carbon atoms of the protein.

