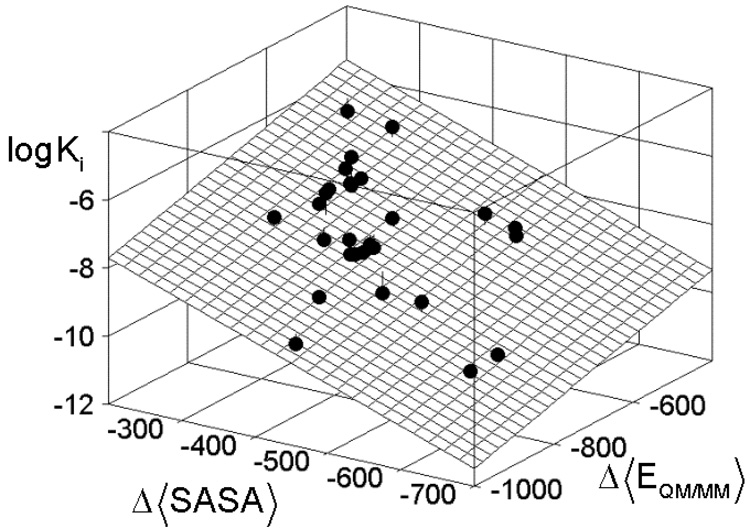
Figure 3.
Experimental inhibition constants Ki (M) of hydroxamates (Table 1) vs MMP-9 as a linear combination of the change in the SASA (Å2) caused by binding and the QM/MM interaction energy (kcal/mol) for the time-averaged structures obtained by MD simulation.

