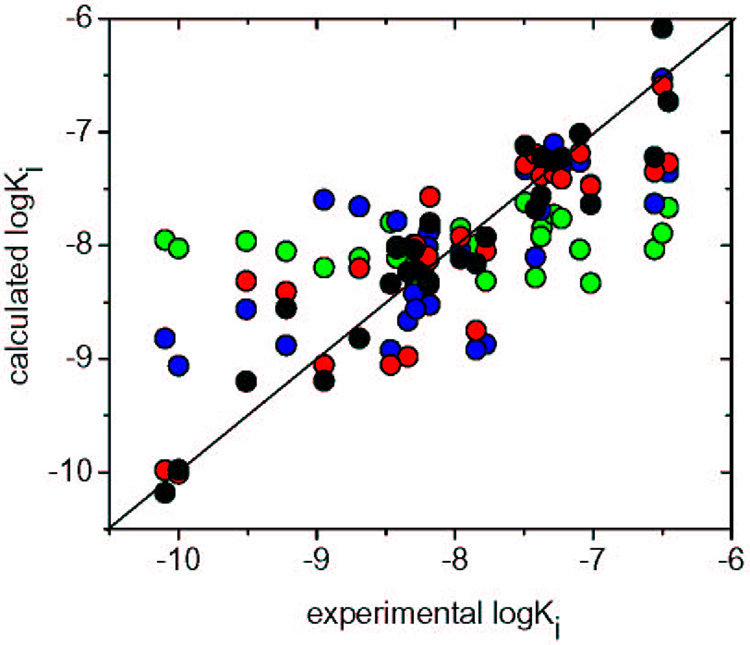
Figure 4.
Correlations between experimental and calculated inhibition potencies of hydroxamates vs. MMP-9 as obtained by FlexX docking with the zinc binding based selection of modes in Step 1 (green), QM/MM minimization in Step 2 (blue), MD simulation with constrained zinc bonds in Step 3 (red), and by QM/MM energy calculations for the time-averaged structures from MD simulation in Step 4 (black). All correlation results are summarized in Table 2.

