Abstract
Targetfinder.org (http://targetfinder.org/) provides a web-based resource for finding genes that show a similar expression pattern to a group of user-selected genes. It is based on a large-scale gene expression compendium (>1200 experiments, >13 000 genes). The primary application of Targetfinder.org is to expand a list of known transcription factor targets by new candidate target genes. The user submits a group of genes (the ‘seed’), and as a result the web site provides a list of other genes ranked by similarity of their expression to the expression of the seed genes. Additionally, the web site provides information on a recovery/cross-validation test to check for consistency of the provided seed and the quality of the ranking. Furthermore, the web site allows to analyse affinities of a selected transcription factor to the promoter regions of the top-ranked genes in order to select the best new candidate target genes for further experimental analysis.
INTRODUCTION
Unravelling the transcriptional network governing cells of higher organisms is a major challenge for computational and experimental cell biology (1). Although sequence-based predictions are dominated by false signals (2), meta-analyses built on them have been shown to be helpful. For example, it has become a standard to search for over-represented putative binding sites of transcription factors in sets of regulated genes obtained from microarray experiments (3). Moreover, it has been shown that one may identify transcription factors that regulate a particular cellular processes by searching for over-represented putative transcription factors binding sites in groups of genes involved in the process (4). In contrast, sequence-based methods do not provide interpretable information if one is interested in regulation of a particular gene and has no prior information which transcription factor is involved. Similarly, prediction of novel transcription factor targets based purely on sequence information has also limited power. These problems are unlikely to be solved in future by pure sequence-based methods because of the high degeneracy and low information content of DNA-binding motifs and long promoter stretches in DNA (2).
We reasoned that large gene expression panels, accumulated over the last decade in publicly accessible databases, are a valuable data source that can be exploited in order to identify genes that are regulated by the same transcription factor. Therefore, we developed a method based on analysis of functionally relevant co-expression data. This strategy allows to identify genes that are co-regulated among many conditions in such large-scale expression data sets, and are thus likely to be regulated by the same transcription factor or set of them. The method requires a set of known transcription factor targets to be provided by the user (the ‘seed’). Subsequently, it ranks genes based on their co-expression pattern in a large microarray panel. We have applied this strategy previously to identify novel targets of the transcription factor NFκB, which were validated experimentally (5). We have shown that the usage of functional co-expression data improves the prediction of transcription factor target genes. In this study, we also found that a seed of 10 genes may contain sufficient functional information to expand the seed by novel candidate genes.
Since then, we developed a web server to make this resource available and also provide statistical tools to assess the quality of the predictions. In this article, we describe the web resource, which requires no registration and is publicly available at http://targetfinder.org/.
TARGETFINDER.ORG SERVER
The Targetfinder.org server has been developed to address a common biological question—given a set of genes of interest—which other genes have a similar expression profile. Using this method the user may extend a list of known transcription factor targets by new candidate target genes based on experimental data.
The prediction for each user input is checked by a cross-validation analysis. This allows to estimate the quality of the ranking that depends also on the quality of the seed.
The methodology behind Targetfinder.org has been verified previously from the statistical point of view. In a previous work, we used a seed of known NFκB targets and identified 16 putative targets of NFκB that were not in the seed. Out of those targets, eight have been experimentally verified by other groups, and we tested three additional ones (5). All evaluated promoters showed functional experimental evidence to be a target of NFκB. The status of the remaining five putative targets has not been addressed so far.
GENERAL WORKFLOW
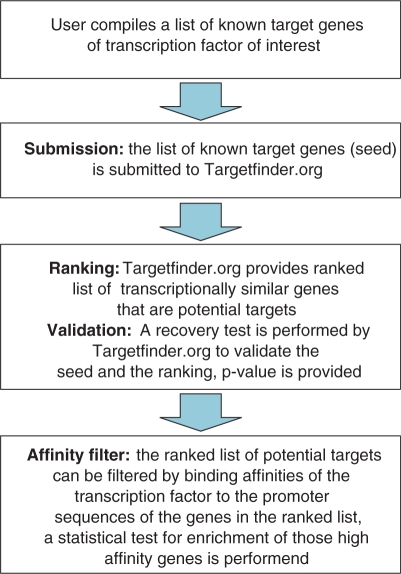
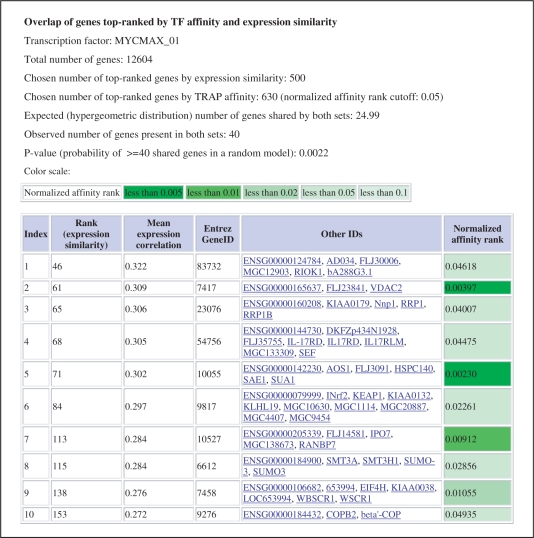
To start the calculation the user provides a list of known targets (seed) of a transcription factor of interest (Figure 1). We implemented identifier mapping in Targetfinder.org, so the user can submit genes identified by various types of IDs or gene abbreviations. The results of this mapping are reported on the results page, such that they can be cross-checked whether the identifiers are correctly mapped. The translated input list is then used for the mathematical procedures in the server to predict new target gene candidates. The top-ranking genes are then reported in a tabular form. The list can then be interactively filtered for genes that we predict as high-affinity binding targets of a selected transcription factor. These genes for which the promoters show high-ranking affinity are colour coded (Figure 2). All calculated results can be downloaded as text or html, and figures can be downloaded in pdf and jpeg file formats.
Figure 1.
Outline of the user interaction with the Targetfinder.org web server.
Figure 2.
An example output of Targetfinder.org. The ranked table shows predicted genes that have similar expression to a given set of C-MYC targets. Moreover, only the genes that are among top-predicted targets of this transcription factor are shown. The presentation of the estimated binding affinity is colour coded to highlight top-ranking affinities in the output list.
EXAMPLES
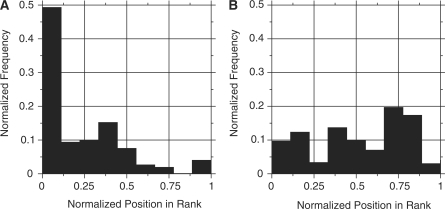
The Targetfinder.org web site contains several example seed data sets of known transcription factor targets (6–10). They might be easily used for calculation by clicking the corresponding buttons on the web site, which copy the example seeds to the input field. In addition, the input form provides an additional button to use a random gene set as input. The calculation is validated by a recovery test to estimate the quality of the seed (Figure 3). For random gene groups, we observe flat histograms (see for example Figure 3B). In contrast, genes from a consistent seed are enriched in the top ranks, therefore the histogram shows a strong peak in the first bin (Figure 3A). We report a P-value quantifying the chance to obtain at least the observed gene enrichment in the first bin for a random data set. For the example seeds containing experimentally verified targets, we observe significant enrichment in the recovery test (C-MYC: P < 10- 10, NFκB: P < 10- 10, E2F: P < 10- 14, ETS1: P < 2 × 10 - 4, HIF1a: P < 10- 6 and HNF4: P < 6 × 10 - 4).
Figure 3.
Recovery test for: (A) the C-MYC seed and (B) a random seed. Seeds of 51 known C-MYC targets or 51 random genes were submitted to Targetfinder.org. Then, repeatedly 10% of seed genes were randomly taken out and their similarity to the remaining genes was calculated. For consistent seeds, such as C-MYC, we observe a strong enrichment of top ranks (first bin of the histogram strongly enriched P < 10- 10. For random seeds the histogram shows no significant enrichment of the top ranks  .
.
MATERIALS AND METHODS
The core module of the Targetfinder.org algorithm has been implemented as a monolithic C++ program that maps the genes provided by the user to the seed and then evaluates similarities of all other genes to the seed genes. The result is stored in the XML format and then converted by additional scripts to tables and charts displayed on the output page. The calculation is based on an array containing normalized gene expressions in various conditions and on another array with predicted transcription factor affinities to the genes.
Expression array
The Stanford Microarray database (11) was used as the source of expression data. Based on these data and following normalization strategies as in Stuart et al. (12), we constructed an expression array for a collection of 13 595 genes evaluated in 1202 different and independent experiments (from studies of diverse biological processes, including cell cycle, stress, signalling, apoptosis and from expression profiles of cell lines and different tissue and cancer samples). Some elements of the expression array have undefined values, as the underlying experiments were designed to measure expressions for a subset of genes only. Therefore, when correlations are calculated, the experiments corresponding to missing values are excluded from the calculation.
Mapping gene identifiers to the seed
In the first step of analysis, the gene names provided by the user are mapped to the seed, which must contain only genes for which expression data are available. The input genes might be identified by Ensembl gene ids, Entrez gene ids and names or corresponding Affymetrix probe identifiers. We build identifier mapping tables based on gene cross-reference annotations available in Ensembl (13) version 47. When a provided gene name refers to more than one gene in the expression array, all the target genes are added to the seed. Multiple names corresponding to the same expression array gene are automatically unified. We ignore all gene names which that cannot be mapped to the array genes. The user may access the detailed information on the mapping process in a form of a table, enumerating all provided names, whether they were mapped to the seed, and whether duplicates were encountered.
Ranking genes
Ranking genes based on their expressions correlations with seed genes has an experimentally proven potential to select genes regulated similarly to the seed genes (5). Therefore, all genes with available expression profiles and which are not already included in the seed are ranked based on average correlation with the seed gene expression profiles. The method is described in detail in a previous work (5). On the server we keep the correlations of all gene pairs precalculated, stored in a format that can be directly memory mapped. This way, for seed sizes of practical importance, we could reduce the calculation time to a level acceptable for a web service application.
The result is presented in a form of a sorted table containing the genes with the largest correlations to the seed genes. For each gene, we display its rank, the evaluated correlation and identifiers of the gene in Ensembl and Entrez databases. By default, only the top 10 genes are shown, but a complete list for all genes might be obtained in a form of a simple table.
Seed quality
We perform a recovery test to evaluate quality of the input seed. Iteratively, we randomly exclude 10% of genes from the seed and we calculate the gene ranking with respect to the reduced seed . For each excluded gene we determine its rank with respect to the reduced-seed. The random resampling process is repeated 300 times, which is a compromise between accuracy and calculation time.
The calculated ranks characterize how consistent is expression of a seed gene relative to all other seed genes. For consistent seeds, the genes temporarily excluded from the seed obtain ranks closer to the top. For randomly chosen seeds, the ranks demonstrate a distribution closer to uniform.
The recovery test result is presented in a form of a histogram of observed ranks for all seed genes. The ranks are normalized to a range from 0 to 1, where 0 corresponds to the top rank. In order to quantify seed consistency, we calculate the probability that the count in the first bin of the histogram is as least as extreme as observed in a random set. Figure 3 demonstrates the histogram obtained for a consistent C-MYC seed, which shows a strong enrichment (P < 10- 10) and contrasts it to a result for a random seed of the same size ( ).
).
Affinities of transcription factors
Targetfinder.org allows to evaluate whether genes showing expression similar to the seed genes are also predicted as targets of a chosen transcription factor. The user selects how many top ranking genes should be evaluated. Then, we count how many genes occur at both top rankings and compare their number to the random expectation. We use the Fisher exact test to calculate the probability for two random gene sets of the same sizes to share at least the observed number of common genes. In all our examples, C-MYC, NFκB, E2F, ETS1, HNF4, except HIF1a, the predicted high-affinity targets showed significant enrichment in the top group (for details see the documentation on the web site).
To estimate affinities of a transcription factor to gene promoter regions, we use the TRAP method (14). Positional frequency matrices describing profiles recognized by vertebrate transcription factors are obtained from the Transfac database (15). The promoters are defined as the sequence regions from 300-nt upstream to 100-nt downstream around starts of the gene regions provided by the Ensembl database (13). As before, in order to provide response times acceptable for a web service, an array of affinities of all vertebrate transcription factors to all expression array genes is kept precalculated on the server.
The server
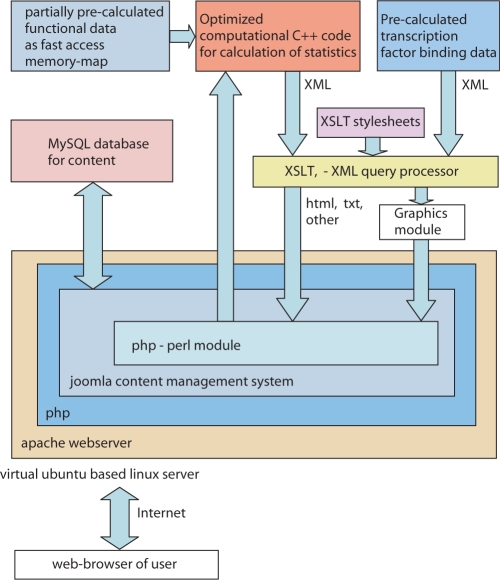
We included our analysis module in Joomla content management system (www.joomla.org), which allows to easily update the information present on the web site. Additionally, Joomla provides session management. The interface between Joomla and the algorithm is presented in Figure 4. Briefly, calls to the Targetfinder.org algorithms are passed using the mod-php module of Joomla, which starts the algorithm or displays the results. Since the output of the calculations is kept in XML format, the presentation of the results is realized by XSLT style sheets. Histograms are produced on the fly by xmgrace.
Figure 4.
This figure outlines the structure and the main data flux in the web server of Targetfinder.org. The high speed calculation is carried out in a optimized C++ program with fast access to a precalculated memory map of the functional expression data. The internal output of this program is structured XML, which is easily formatted by standard XSLT processors and style sheets. The logic of the calculation and data input is handled by a perl module that is embedded in a php module on joomla. Using the content management system, joomla, the content of web server is managed effectively.
CONCLUSIONS
Targetfinder.org has been designed to use expression data to predict genes that are regulated by the same transcription factor as the submitted set of seed genes. In order to help the user in assessing the quality of the seed and the results, we have implemented two methods. First, a cross-validation analysis (the recovery test) is used to identify how many of the submitted seed genes would be among the top predictions if they were removed from the seed. This provides a method to inspect the quality of the input seed, and also to validate the method. Second, we implemented a search for predicted high-affinity targets of a transcription factor among the top predictions of Targetfinder.org. This check, utilizing promoter sequences independent from the expression data, allows to assess whether the resulting genes are likely to be co-regulated with the seed genes. The computational algorithms of the server have been optimized for speed by various techniques such as memory-mapping of precalculated data to allow the user to do the individual analysis on the fly in a web server environment. The quality of the seed is crucial for optimal prediction. In cases when the seed contains functional subclusters in a way that the ranking and the recovery test will give suboptimal results, a separate analysis of the subclusters would improve the analysis. It is planned to add an appropriate feature addressing this issue in a future version of Targetfinder.org. Moreover, we plan to update source databases on a yearly basis.
Biological relevance of similar strategies has been demonstrated. The covariance-based extraction of regulatory targets (CERMT) method (16) utilizes multiple short expression time series to identify highly responding Arabidopsis thaliana genes. Target genes of p53 in mammalian cells have been studied (17) using hidden variable dynamic modelling. Based on advanced mathematical models, both approaches generate ranked lists of putative transcription factor targets using time series microarray data. In contrast, our method has been designed for experiments where time series data are not available. Instead, we utilize normalized expression data collected in a public database. Additionally, we provide a mechanism for further filtering the candidates based on predicted transcription factor affinities to promoters of the candidate genes. Other approaches available require specifically designed pathway perturbation experiments (3).
Taken together, Targetfinder.org provides a powerful tool to predict potential new transcription factor target genes by making use of functional large-scale co-expression data sets in combination with binding affinity data. This strategy is more powerful than methods that rely purely on sequence-based information. As it has been demonstrated before, the methodology of Targetfinder.org has been successfully used to identify NFκB target genes, among them optineurin, a gene important in human glaucoma (5,18). We believe that exposing this resource and methodology will be useful for other researchers that have no access to expensive large-scale experimental methods to select the best candidates for novel target genes of the transcription factor that they are interested in.
AVAILABILITY
The web site is free and open to all users at http://www.targetfinder.org/ and there is no login requirement.
FUNDING
German Federal Ministry of Education and Research (BMBF; grants FORSYS-Partner to N.B., MedSys FKZ 0315398A to R.M., NGFN-Plus 01GS0815 to Sz.M.K.), Deutsche Forschungsgemeinschaft (DFG; grants FA 845/2-1 to M.F. and SFB618 to N.B.). Funding for open access charge: BMBF (grant MedSys FKZ 0315398A), DFG (grants FA 845/2-1 and SFB618).
Conflict of interest statement. None declared.
REFERENCES
- 1.Amit I, Garber M, Chevrier N, Leite AP, Donner Y, Eisenhaure T, Guttman M, Grenier JK, Li W, Zuk O, et al. Unbiased reconstruction of a mammalian transcriptional network mediating pathogen responses. Science. 2009;326:257–263. doi: 10.1126/science.1179050. [DOI] [PMC free article] [PubMed] [Google Scholar]
- 2.Wasserman WW, Sandelin A. Applied bioinformatics for the identification of regulatory elements. Nat. Rev. Genet. 2004;5:276–287. doi: 10.1038/nrg1315. [DOI] [PubMed] [Google Scholar]
- 3.Tullai J, Schaffer M, Mullenbrock S, Kasif S, Cooper G. Identification of transcription factor binding sites upstream of human genes regulated by the phosphatidylinositol 3-kinase and mek/erk signaling pathways. J. Biol. Chem. 2004;279:20167–20177. doi: 10.1074/jbc.M309260200. [DOI] [PubMed] [Google Scholar]
- 4.Blüthgen N, Kiełbasa SM, Herzel H. Inferring combinatorial regulation of transcription in silico. Nucleic Acids Res. 2005;33:272–279. doi: 10.1093/nar/gki167. [DOI] [PMC free article] [PubMed] [Google Scholar]
- 5.Mrowka R, Blüthgen N, Fähling M. Seed-based systematic discovery of specific transcription factor target genes. FEBS J. 2008;275:3178–3192. doi: 10.1111/j.1742-4658.2008.06471.x. [DOI] [PubMed] [Google Scholar]
- 6.Fernandez PC, Frank SR, Wang L, Schroeder M, Liu S, Greene J, Cocito A, Amati B. Genomic targets of the human c-myc protein. Genes Dev. 2003;17:1115–1129. doi: 10.1101/gad.1067003. [DOI] [PMC free article] [PubMed] [Google Scholar]
- 7.Bracken AP, Ciro M, Cocito A, Helin K. E2f target genes: unraveling the biology. Trends Biochem. Sci. 2004;29:409–17. doi: 10.1016/j.tibs.2004.06.006. [DOI] [PubMed] [Google Scholar]
- 8.Wu JT, Kral JG. The nf-kappab/ikappab signaling system: a molecular target in breast cancer therapy. J. Surg. Res. 2005;123:158–169. doi: 10.1016/j.jss.2004.06.006. [DOI] [PubMed] [Google Scholar]
- 9.Semenza GL. Targeting HIF-1 for cancer therapy. Nat. Rev. Cancer. 2003;3:721–732. doi: 10.1038/nrc1187. [DOI] [PubMed] [Google Scholar]
- 10.Sementchenko VI, Watson DK. Ets target genes: past, present and future. Oncogene. 2000;19:6533–6548. doi: 10.1038/sj.onc.1204034. [DOI] [PubMed] [Google Scholar]
- 11.Demeter J, Beauheim C, Gollub J, Hernandez-Boussard T, Jin H, Maier D, Matese JC, Nitzberg M, Wymore F, Zachariah ZK, et al. The stanford microarray database: implementation of new analysis tools and open source release of software. Nucleic Acids Res. 2007;35:D766–D770. doi: 10.1093/nar/gkl1019. [DOI] [PMC free article] [PubMed] [Google Scholar]
- 12.Stuart JM, Segal E, Koller D, Kim SK. A genecoexpression network for global discovery of conserved genetic modules. Science. 2003;302:249–255. doi: 10.1126/science.1087447. [DOI] [PubMed] [Google Scholar]
- 13.Hubbard TJP, Aken BL, Ayling S, Ballester B, Beal K, Bragin E, Brent S, Chen Y, Clapham P, Clarke L, et al. Ensembl 2009. Nucleic Acids Res. 2009;37:D690–D697. doi: 10.1093/nar/gkn828. [DOI] [PMC free article] [PubMed] [Google Scholar]
- 14.Roider HG, Kanhere A, Manke T, Vingron M. Predicting transcription factor affinities to dna from a biophysical model. Bioinformatics. 2007;23:134–141. doi: 10.1093/bioinformatics/btl565. [DOI] [PubMed] [Google Scholar]
- 15.Matys V, Kel-Margoulis OV, Fricke E, Liebich I, Land S, Barre-Dirrie A, Reuter I, Chekmenev D, Krull M, Hornischer K, et al. Transfac and its module transcompel: transcriptional gene regulation in eukaryotes. Nucleic Acids Res. 2006;34:D108–D110. doi: 10.1093/nar/gkj143. [DOI] [PMC free article] [PubMed] [Google Scholar]
- 16.Redestig H, Weicht D, Selbig J, Hannah MA. Transcription factor target prediction using multiple short expression time series from Arabidopsis thaliana. BMC Bioinformatics. 2007;8:454. doi: 10.1186/1471-2105-8-454. [DOI] [PMC free article] [PubMed] [Google Scholar]
- 17.Barenco M, Tomescu D, Brewer D, Callard R, Stark J, Hubank M. Ranked prediction of p53 targets using hidden variable dynamic modeling. Genome Biol. 2006;7:R25. doi: 10.1186/gb-2006-7-3-r25. [DOI] [PMC free article] [PubMed] [Google Scholar]
- 18.Rezaie T, Child A, Hitchings R, Brice G, Miller L, Coca-Prados M, Héon E, Krupin T, Ritch R, et al. Adult-onset primary open-angle glaucoma caused by mutations in optineurin. Science. 2002;295:1077–1079. doi: 10.1126/science.1066901. [DOI] [PubMed] [Google Scholar]


