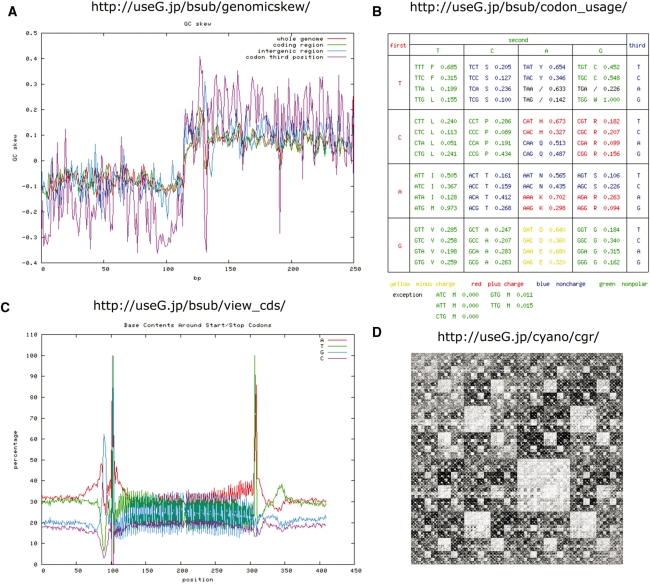
Figure 2.
Examples of graphical analysis results. (A) GC skew graph calculated in all regions of the entire genome (red), coding regions (green), intergenic regions (blue) and third nucleotide in codons (purple) with genomicskew function in B. subtilis genome. (B) Codon table of B. subtilis genome visualized with codon_usage function. (C) Nucleotide frequency in regions of 100 bp around start and stop codons using all genes within the genome of B. subtilis using view_cds function. Strong conservation of nucleotides at start and stop codons, as well as conserved upstream Shine–Dalgarno sequence can be observed. (D) Chaos game representation visualized for Synechococus sp.

