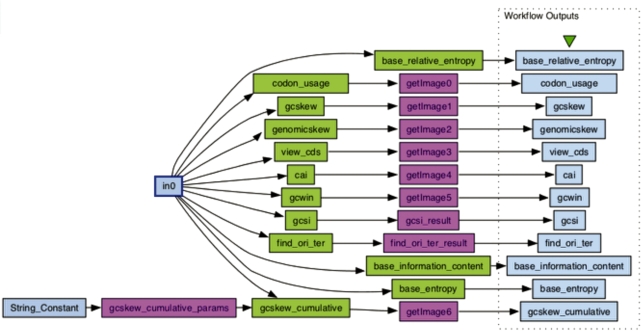
Figure 3.
Example workflow loaded in Taverna. This workflow calculates and graphs the DNA sequence conservation around the start codon in terms of relative entropy (base_relative_entropy), entropy (base_entropy) and information content (base_information_content) (20), calculates the codon usage (codon_usage), graphs the GC skew (gcskew), cumulative GC skew (gcskew_cumulative), GC skew in multiple regions of genome (genomicskew) (21), visualizes the nucleotide composition around the coding regions (view_cds), calculates the Codon Adaptation Index and predicts gene expression levels (cai) (22), visualizes the GC content (gcwin), calculates the GC Skew Index (gcsi) (8), and predicts the origin and terminus of replication (find_ori_ter) (7).

