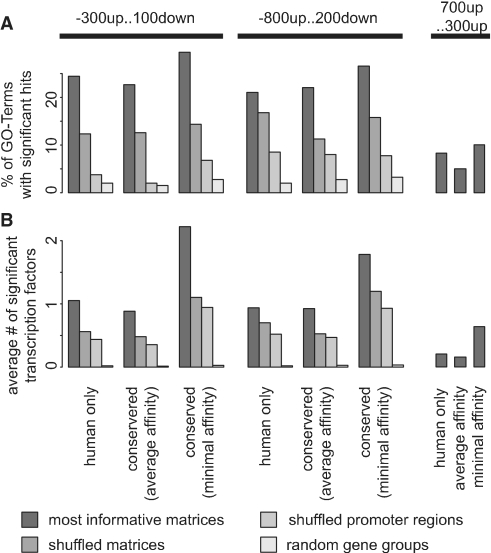
Figure 4.
Performance of TransFind. We defined 397 sets of genes which were annotated with top Gene Ontology terms and searched for enriched putative transcription factor targets using different parameters. Results for original data (dark grey) are compared to results for shuffled matrices or promoter sequences (medium grey) or to random gene sets of the same size distribution (light grey). Panel A shows the fraction of GO sets with at least one significant factor and panel B shows the average number of discovered factors in a GO set.

