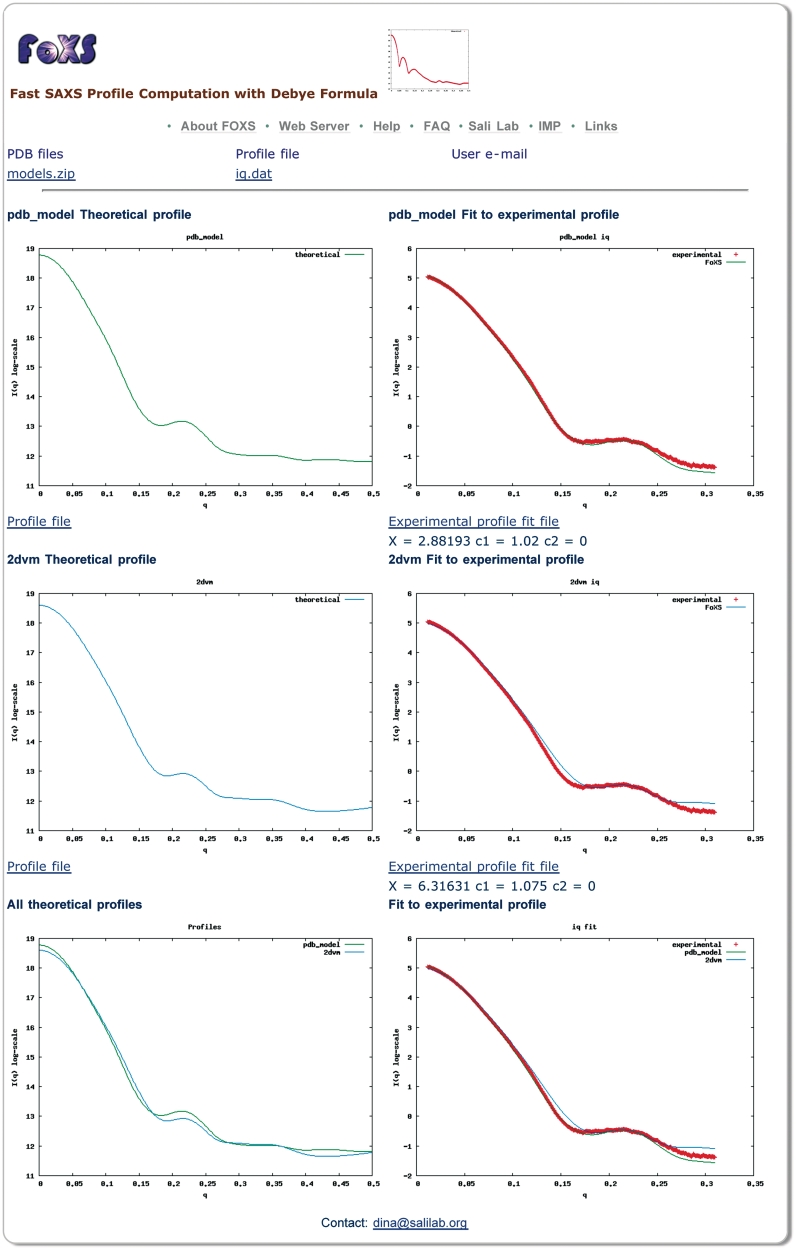
Figure 1.
Snapshot of a FoXS output page. Computed profiles of two PDB files are compared to the experimental SAXS profile of malic enzyme (data from http://bioisis.net/, PF1026). The first structure (pdb_model) includes a model of the unfolded His tag region (35 residues), while the second structure (2dvm) does not. The server was run with the default parameters and the hydration layer modeling was disabled. Plots on the left display the theoretical profiles and plots on the right display their fit to the experimental profile. The top two plots are for the structure with the modeled unfolded region (pdb_model), the middle two plots are for the original PDB file (2dvm), the bottom left plot overlay the profiles for the two input structures, and the bottom right plot shows their fit to the experimental profile. The structure with the modeled unfolded region shows a better fit to the experimental profile with the value of χ = 2.88, compared to χ = 6.33 for the original crystallographic structure. The user can follow the links to download the computed profiles and their fittings.

