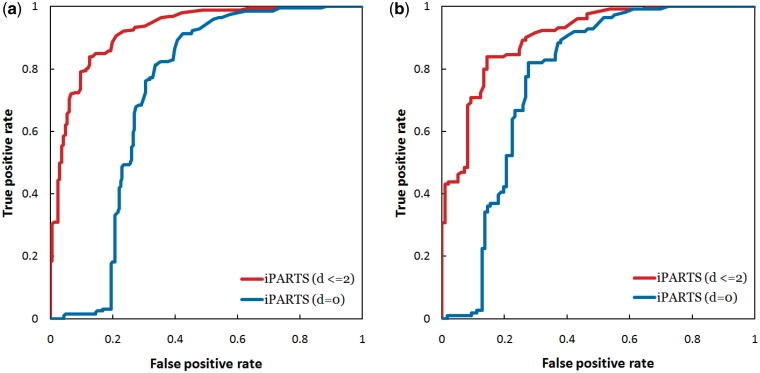
Figure 4.
The ROC curves when testing our iPARTS for its capability of function assignment using (a) the FSCOR data set, where the AUC values for d = 0 and d ≤ 2 are 0.72 and 0.92, respectively, and (b) the R-FSCOR and T-FSCOR data sets, where the AUC values for d = 0 and d ≤ 2 are 0.77 and 0.90, respectively.

