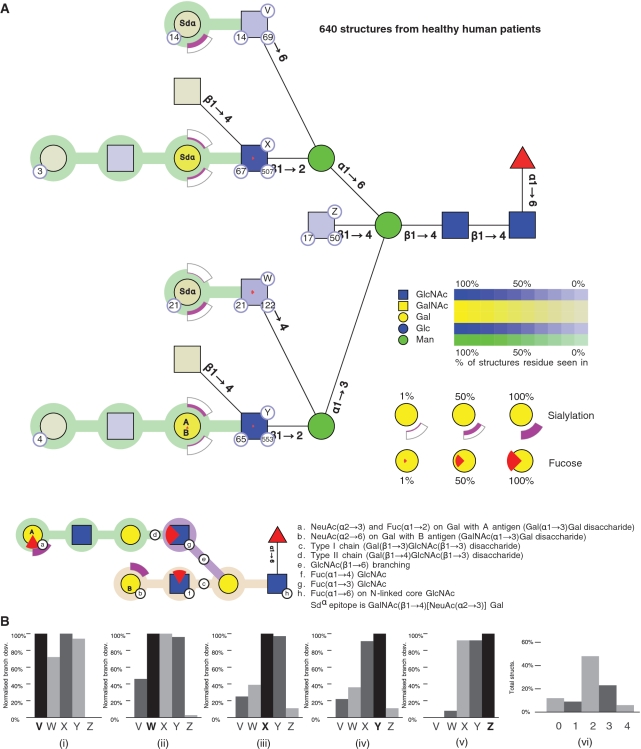
Figure 1.
The composite structure for 640 N-glycans, derived from human tissue. (A) Residues in all structures have CFG icons and colours with saturation of colour representing the abundance of a residue in the set of structures. Residues may be annotated to show the number of structures in the database containing a residue (number in bottom right circle), number of publications reporting the residue in the structure (number in bottom left circle) and a label (V, W, X, Y, Z) that identifies a branch (capital letter in top right circle). Linkages between core residues are labelled with anomer and ring substitution position whereas linkages in chains have coloured linking connections (explained in the key to the figure). Terminal epitopes upon chains are represented using arcs (NeuAc) and wedges (Fucose). Arcs show the degree of sialylation of a residue in a set of structures; the degree of fill in the arc correlates with the degree of sialylation; the two possible positions of sialylation (α2–3 and α2–6) are positioned below and above the residue, respectively. Wedges show the degree of fucosylation, with full fucosylation represented by a full wedge. A downward-facing wedge is a fucose in an α1–2 linkage, a left-facing wedge represents α1–3 linkage and an upward facing wedge represents an α1–4 linkage. Core fucosylation is shown by a standard symbol. The annotation inside the residues of a chain (e.g. Sdα, A or B) indicate terminal epitopes comprised of Gal and GalNAc residues. (B) Histograms measuring the overall branching characteristics of the set of glycan structures. One histogram is shown per labelled branch (i–v), with each histogram comparing the number of times other branches occur with respect to that branch. Thus the histogram for branch V (i) shows that structures containing branch V can contain branches W–Y but do not contain branch Z. The overall degree of branching in the set of glycans is shown in a second type of histogram (vi), where the proportion of structures in the set containing 0, 1…, n branches is graphed.

