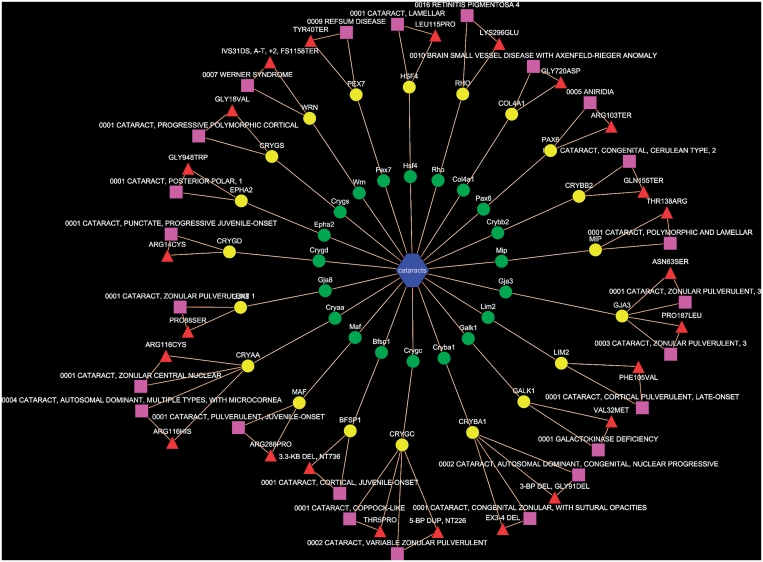
Figure 3.
Network representation of orthologous phenotype network of cataract. The green and yellow colored nodes represent the mouse and human genes associated with cataract, respectively. The pink rectangles are the human allelic variants from OMIM, while the red triangles show the implicated mutation in human genes.

