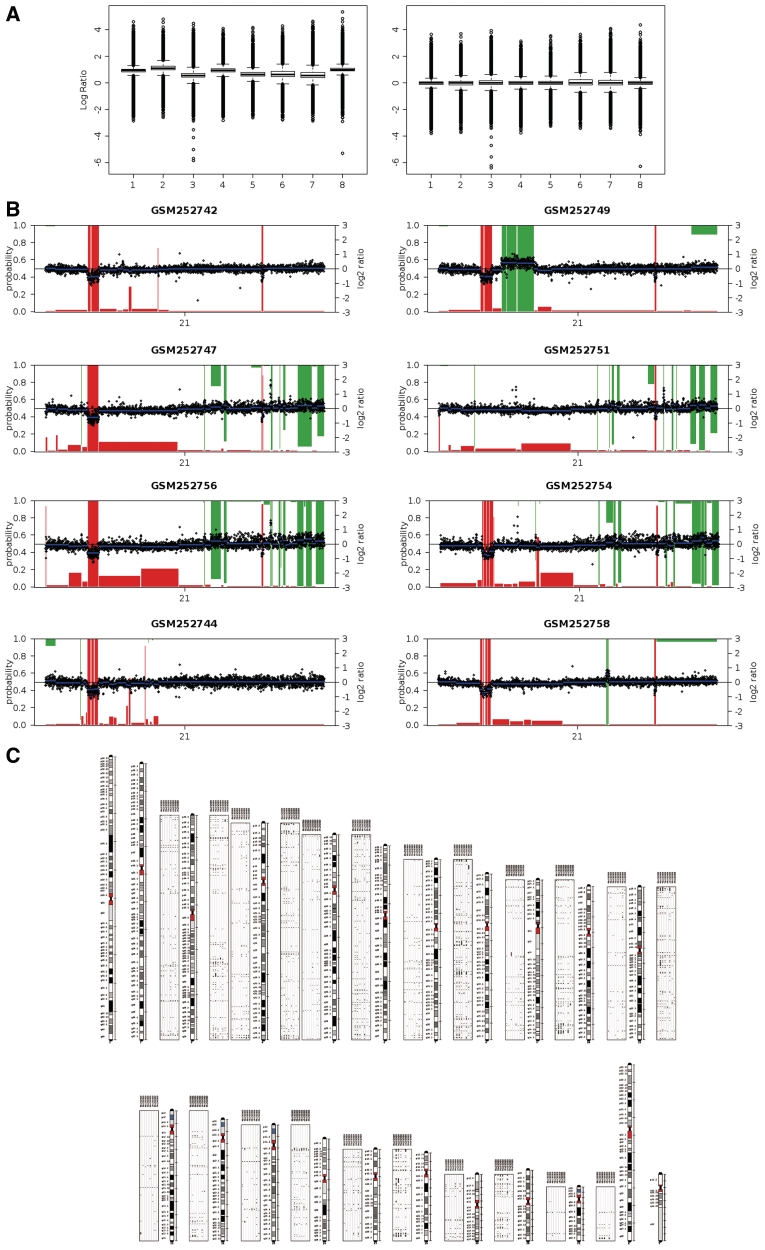
Figure 2.
Example results from a typical analysis. Log-ratios corresponding to the eight samples from Kidd et al. (33) were analyzed. (A) Boxplots of log-ratios after (rigth) and before (left) median normalization. (B) Probability-based calling results for chromosome 21. Black points: normalized log-ratios. Blue lines: DNAcopy-segmented log-ratios. Red bars: loss probability. Green bars: red probability (inverted scale). (C) Karyotype including panels with gains (green, above chromosomes) and losses (red, below chromosomes).

