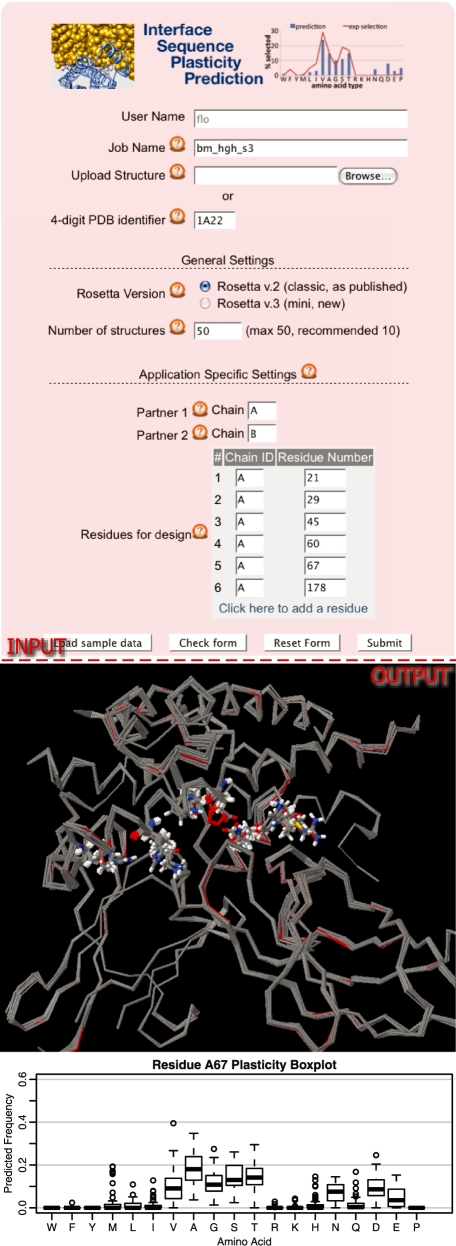
Figure 3.
Application (III) Interface Sequence Plasticity Prediction. The input form (top) holds the general settings (Figure 1) and parameters for the definition of the interface partners and the designed residues. The output (bottom) shows an overlay of the structures of the best scoring sequence for each of 10 initial backrub structures of the human growth hormone receptor complex (PDB ID code: 1A22) and a box-plot of the predicted frequencies of designed amino acid residues at a given designed sequence position (position 67 in chain A).

