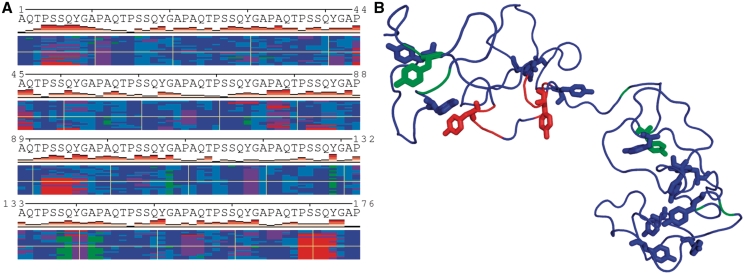
Figure 1.
Visualization of MD trajectory for resilin-like peptide with changes in SS states along the trajectory shown in (A). Red colors correspond to different helices, green to beta states and blue to unstructured regions, bends and magenta to turns, respectively (see POLYVIEW-MM documentation for details). Each row corresponds to an individual snapshot of the structure, an example of which is shown in (B) with tyrosine side chains shown in colors corresponding to initial SS states and using stick models. Note the lack of regular SSs.

