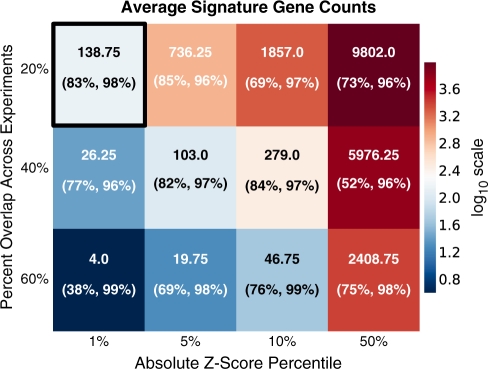
Figure 2.
Average number of SPEED signature genes. SPEED signature genes are sensitive to user-specified parameters. Average signature genes per pathway without the uniqueness constraint are listed as a function of Z-score percentile and percent overlap across experiments. The heat map corresponds to log10 of the average number of signature genes. The sensitivity and specificity is noted in parenthesis. The values for the default parameter set of Z-score percentile ≤1% and percent overlap ≥20% are boxed. Our choice of default parameter set, as well as recommended parameters (in black text) are determined ad hoc based on their biological meaning, resulting number of signature genes and performance metrics. Only the default pathways are considered here and bottom 50% expressed genes are discarded for all calculations.

