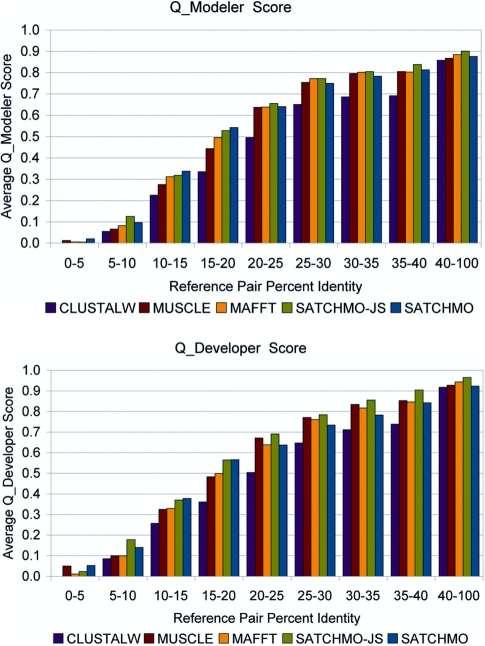
Figure 2.
Benchmarking MSA accuracy. Methods used in this comparison include the original SATCHMO, SATCHMO-JS, ClustalW, MUSCLE and MAFFT (MUSCLE and MAFFT each used five iterations refinement). Results are shown on 983 pairs from the PREFAB benchmark dataset, divided into bins based on the percent identity in the reference structural alignment. The Modeler score (Qmodeler) is a measure of the precision of an alignment, while the Developer score (Qdeveloper) is a measure of the recall. For every percent identity bin, either SATCHMO or SATCHMO-JS produces the best overall performance in both Modeler and Developer scores, with SATCHMO-JS generally producing better results than SATCHMO. Over the dataset as a whole, SATCHMO-JS’s improvement relative to other methods tested is statistically significant (P < 0.05 using Wilcoxon paired score signed rank tests) for all scoring functions (including Qcombined and the Cline Shift score, which balance recall and precision) with a single exception: relative to MAFFT, the difference is significant only for the Developer score (P = 1.138e-05). For the Modeler, Qcombined and Cline Shift scores, the P-values are 0.204, 0.093 and 0.157, respectively. See text for additional details.

