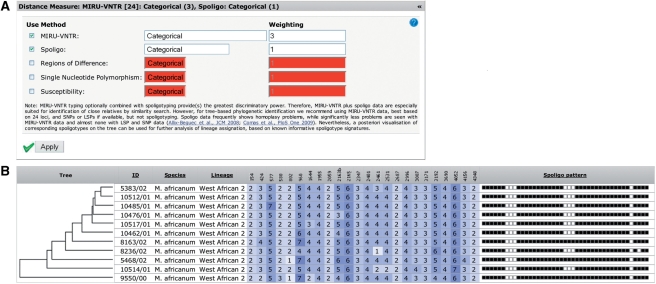
Figure 2.
(A) Input form allowing the selection of the used genotyping methods, distance measures and weightings. (B) Data exploration table. The data for each strain is displayed in a single row. Next to the ID, species and lineage columns, the table contains MIRU-VNTR data highlighted in blue shades, indicating the different copy numbers and spoligotyping patterns. An UPGMA tree is used for ordering the strains.

