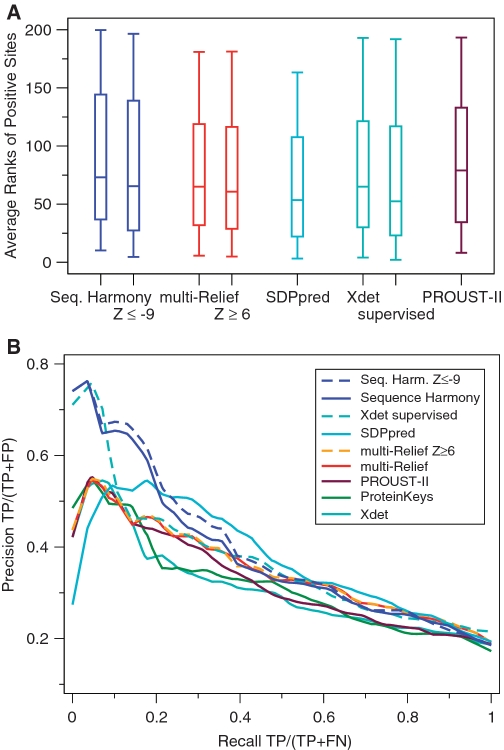
Figure 1.
Validation results for the SH and mR methods. ProteinKeys, PROUST-II, SDPpred v.2 and Xdet are shown for comparison. Results obtained by the different methods were averaged over all data sets weighted by the number of positives. (A) Box plots showing the distribution (as minimum, lower quartile, median, upper quartile and maximum) of ranks of positive sites. Lower is better. (B) Precision/recall (PR) curves showing the relative performance of the methods at different coverage (recall). Higher is better.

