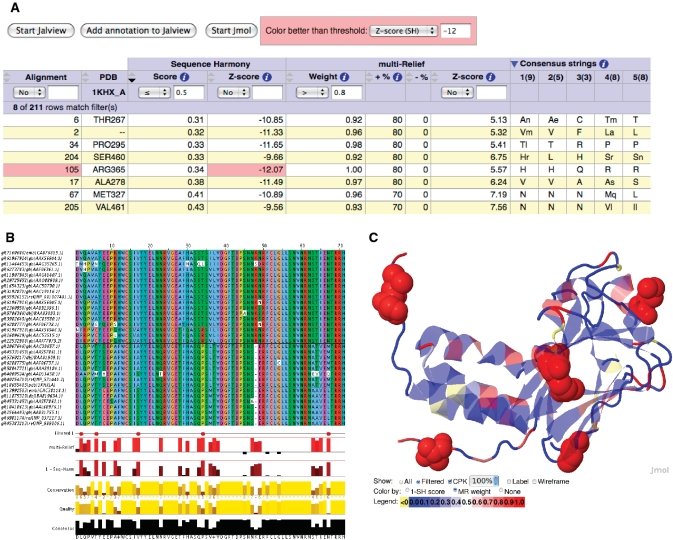
Figure 2.
An example of the multi-Harmony output. (A) The main output table, sorted by SH score and filtered on SH score ( 0.5) and high mR weight (
 0.8). Only ALA278 at position 17 in the alignment is not a confirmed functional residue. The columns with arrows can be sorted. Most of these columns can also be filtered to display only those alignment positions that satisfy the user-supplied thresholds. (B) The output view in Jalview. Groups are outlined in the alignment and filtered positions (from the output table) are marked in the annotation track ‘Filtered 1’ with a tooltip detailing the filter like ‘Positions passing criteria [score
  0.5; weight
  0.8] are indicated’. (C) View of the 3D context using Jmol with the protein coloured by mR weights, and filtered residues (from the output table) labelled and highlighted as space-filling spheres. Colouring by SH scores is also possible.

