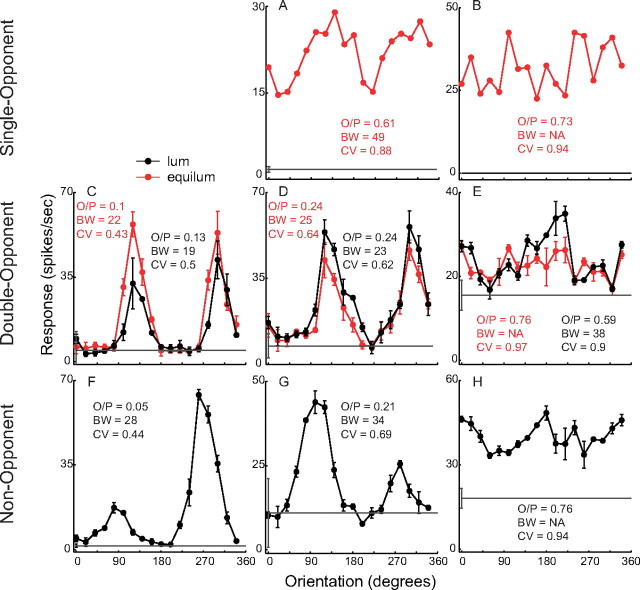
Figure 4.
Orientation tuning curves of representative single-opponent, double-opponent, and non-opponent neurons. Orientation tuning was measured with red–green equiluminant (equilum) patterns (red) and with luminance (lum) patterns (black; contrast, 0.15). Three measures of orientation selectivity are in the insets to the graphs: O/P, BW, and CV. O/P and CV are dimensionless measures with the range [0,1]. The horizontal gray line in each graph is the average baseline firing rate, with the error bar indicating the ±1 SD, measured in the absence of visual stimulation. Note that there are different vertical scales for different cells because of the diversity in responsivity. A, B, Single-opponent cells responded vigorously to red–green gratings and not at all to luminance gratings of matched cone contrast but were not orientation selective (high O/P, BW, and CV). Cell A was from an unknown layer, and cell B was in layer 6. C–E, The double-opponent cells responded to both color and luminance as indicated by the equiluminant and luminance orientation tuning curves. Some double-opponent cells were highly selective (C), and others nonselective (E). The O/P, BW, and CV are nearly the same for equiluminant and luminance stimuli. Cell C was in layer 4B, cell D was in layer 2/3, and cell E was in layer 4Cβ. F–H, Non-opponent cells studied with luminance gratings also could be highly selective (F) and nonselective (H). Cell F was in layer 4Cα, cell G was in layer 4B, and cell H was in layer 4Cβ.

