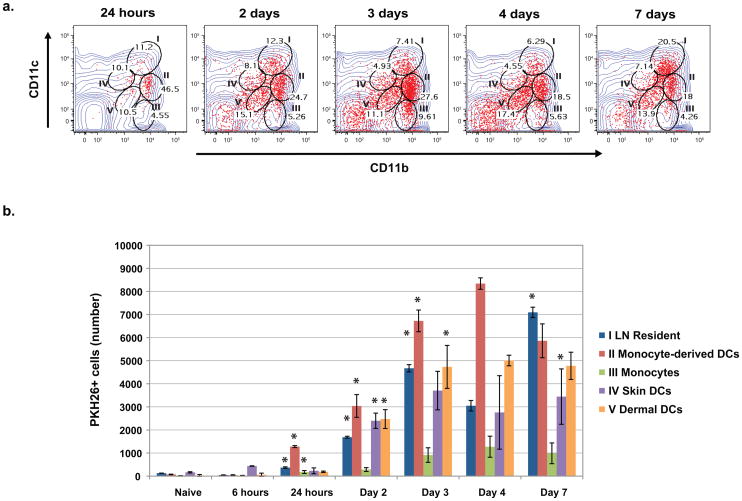
Figure 2. The dynamic distribution of yeast-Ag loaded cells in the draining LNs.
Mice were analyzed serially for 7 d after vaccination. LN cells withPKH26 + yeast (red) were analyzed and gated according to expression of CD11c and CD11b. (A) Gates and roman numerals correspond to those in Fig. 1. The changing distribution of PKH26+ yeast and percent of PKH26+ cells in each gate and population is depicted over time. (B) The distribution of PKH26+ yeast among the LN cell populations is shown in absolute numbers at each time point. Data are the mean ± SD of 2 independent experiments each with 4 mice per time point or group. *, p <0.05 denotes the subset increased significantly at that time point vs. the preceding one.

