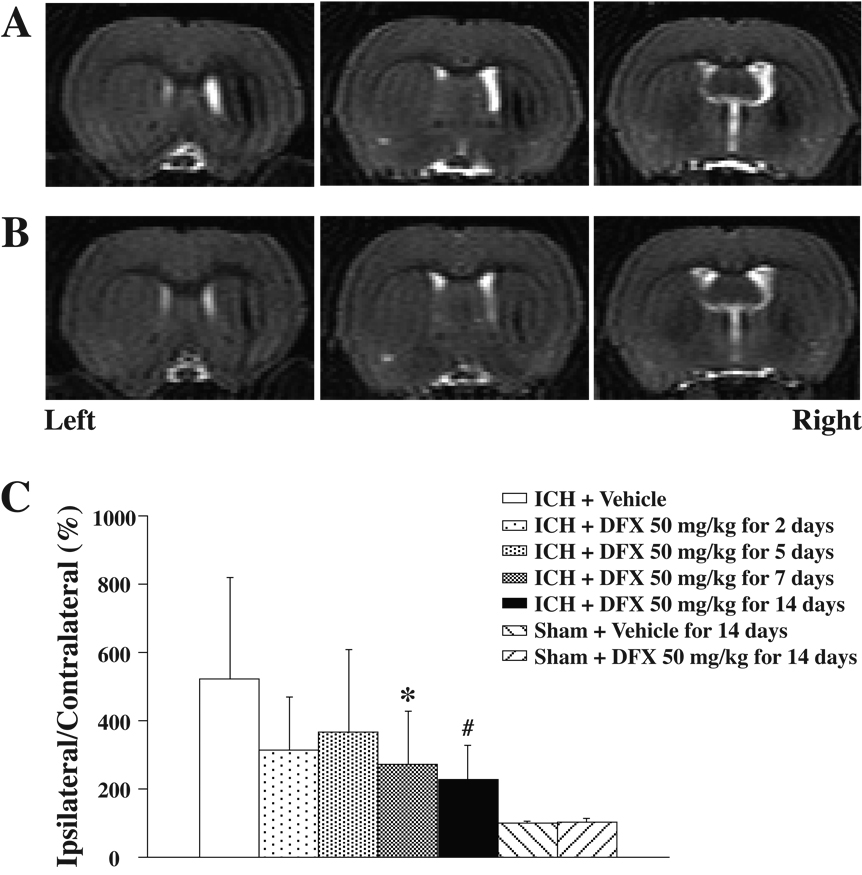
Figure 3.
A and B: T2-weighted magnetic resonance images at eight weeks after ICH treated with vehicle (A) or DFX 50 mg/kg starting 4 hours after ICH for 7 days (B); C: Bar graph showing ventricle volume expressed as a percentage of the contralateral side. Values are expressed as the means±SD. *p<0.05, #p<0.01 vs. ICH+Vehicle group.

