
Figure 3.
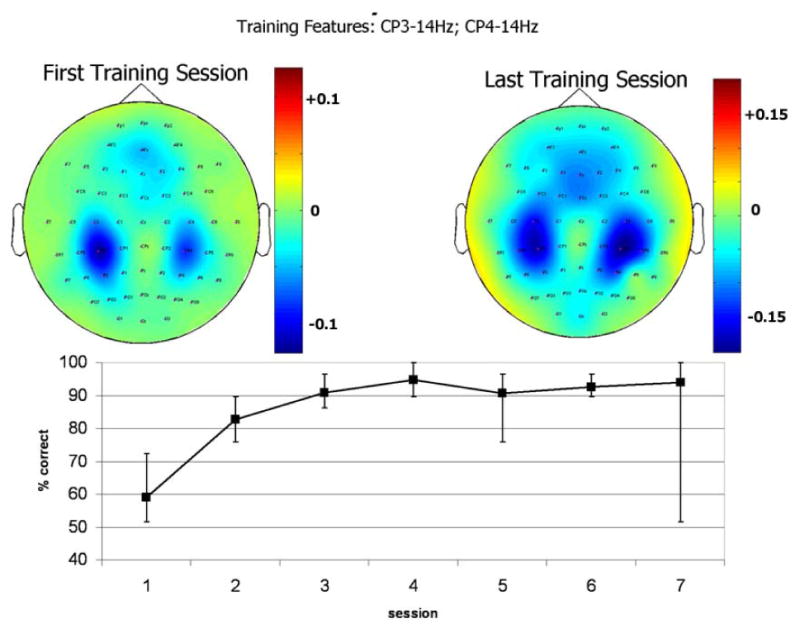
Relevant EEG features and learning curve of a representative able-bodied user. Top panel: topographical maps of r2 values during the first (to the left) and the last (to the right) training sessions, for EEG spectral features extracted at 14 Hz. The patterns changed both in spatial distribution and in absolute value (note the different color scales). Bottom panel: time course of BCI performance over training sessions, as measured by the percentage of correctly selected targets. Error bars indicate the best and the worst experimental run in each session.