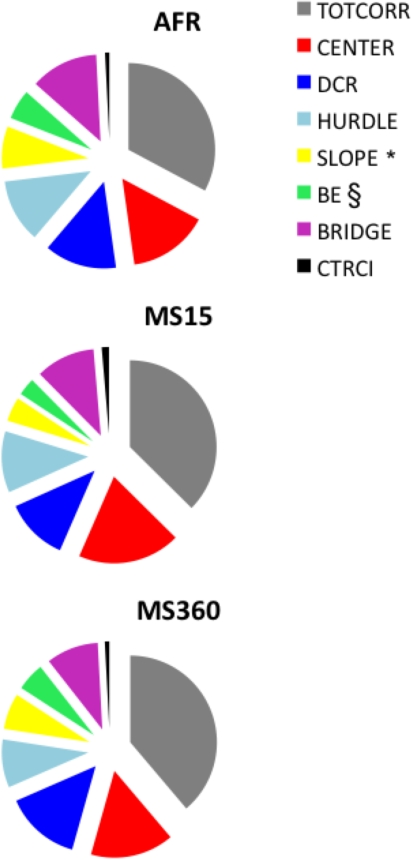
Figure 2.
The percentage of time spent in the defined zones of the MCSF test in AFR, MS15, and MS360 dams (n = 6/group). §p < 0.10, *p < 0.05 (Kruskal–Wallis test); MS15 dams spent significantly less amount of time on the SLOPE (Z = 2.88; p < 0.01) and BRIDGE ENTRANCE (Z = 2.08; p < 0.05) than AFR dams (Mann–Whitney U-test).

