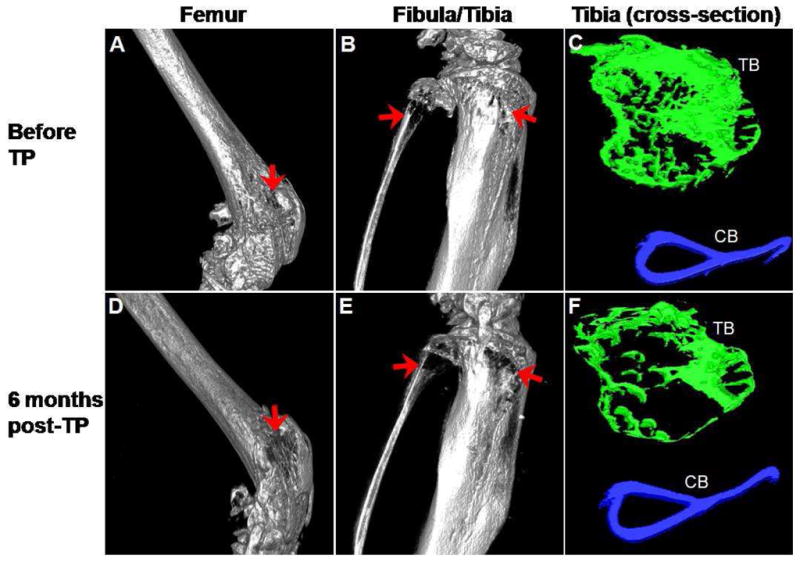
Figure 2.

Micro-CT images of femur and fibula and tibia from a non-engrafted osteogenesis imperfecta murine (oim) mouse. The irregular bone structure and gaps in the bone seen at initial imaging before transplantation (arrows, A and B) worsened 6 months later (D and E). Comparison of the cross-sectional tibial images before transplantation (C) and after 6 months (F) also showed marked loss in trabecular architecture. TB indicates trabecular bone and CB indicates cortical bone. The images in A, B, D and E are shown at ~ 100% magnification, C and F are shown at ~ 290% magnification. Correlative images are all displayed using the same threshold values.
