
Figure 2.
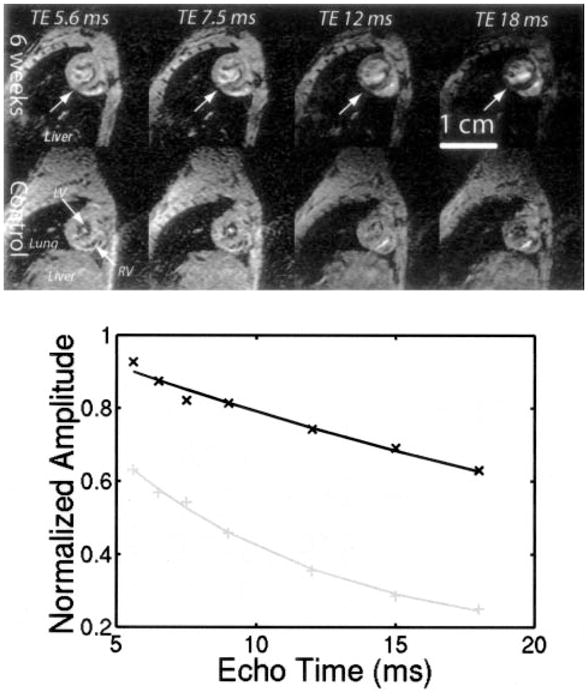
Top, Representative short-axis images at 4 different echo times illustrating T2* darkening in heart. Liver, lung, left ventricular cavity (LV), and right ventricular cavity (RV) are shown in bottom left panel. All tissues darken from left to right with a rate proportional to T2*. Top 4 panels represent iron-loaded animal, and middle 4 panels represent age-matched control. Liver signal is completely obliterated in iron-loaded animal, but heart T2* darkening can be appreciated by tracking LV myocardium from left to right (arrows, top panels). Bottom, Average signal intensity in interventricular septum as function of echo time. Data were fit to monoexponential T2* decay. Control animal had T2* of 31.5 ms, and iron-loaded animal had T2* of 7.7 ms.