
Figure 4.
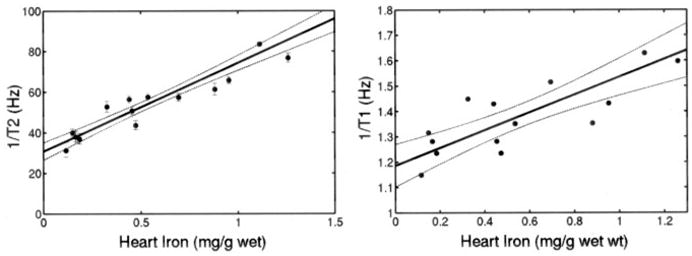
Plot of ex vivo cardiac 1/T2 and cardiac 1/T1 (measured by NMR relaxometer) vs cardiac iron concentration (wet weight). Linear fit is shown; r2 is 0.955 and 0.776, respectively. Dashed lines represent 95% CI for regression. Individual error bars represent 95% CI predicted by NMR spectrometer fitting algorithm (T1 fitting errors too small to be plotted).